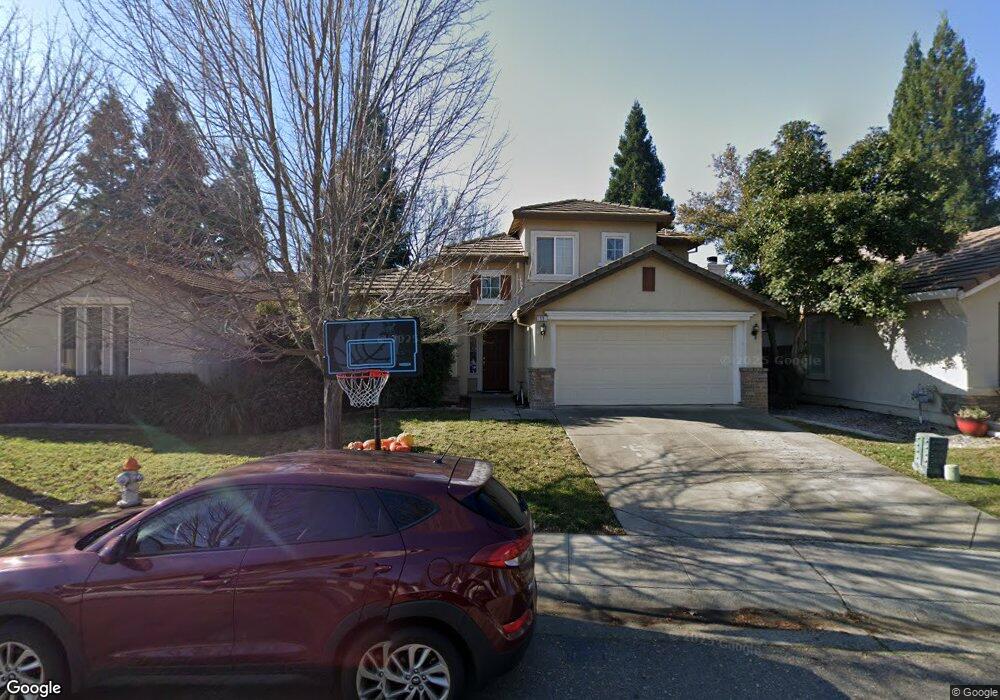
11 Dunlin Ct Sacramento, CA 95833
Willow Creek NeighborhoodEstimated Value: $255,000 - $751,000
4
Beds
3
Baths
2,241
Sq Ft
$258/Sq Ft
Est. Value
About This Home
This home is located at 11 Dunlin Ct, Sacramento, CA 95833 and is currently estimated at $578,322, approximately $258 per square foot. 11 Dunlin Ct is a home located in Sacramento County with nearby schools including Two Rivers Elementary School, Natomas Middle School, and Natomas High School.
Ownership History
Date
Name
Owned For
Owner Type
Purchase Details
Closed on
Aug 9, 2011
Sold by
Olievskiy Alevtina
Bought by
Olievskiy Roman
Current Estimated Value
Purchase Details
Closed on
Jul 28, 2011
Sold by
Ollevskly Roman
Bought by
Chien Bruce and Lu Tiffany
Purchase Details
Closed on
May 31, 2011
Sold by
Ruelas Lucy and Ruelas Eufemio
Bought by
Olievskiy Roman
Purchase Details
Closed on
Sep 10, 2002
Sold by
Citation Northern
Bought by
Ruelas Eufemio and Ruelas Lucy
Home Financials for this Owner
Home Financials are based on the most recent Mortgage that was taken out on this home.
Original Mortgage
$263,646
Interest Rate
6.37%
Create a Home Valuation Report for This Property
The Home Valuation Report is an in-depth analysis detailing your home's value as well as a comparison with similar homes in the area
Home Values in the Area
Average Home Value in this Area
Purchase History
| Date | Buyer | Sale Price | Title Company |
|---|---|---|---|
| Olievskiy Roman | -- | Fidelity National Title Co | |
| Chien Bruce | $246,000 | Fidelity National Title Co | |
| Chien Bruce | $247,000 | Fidelity National Title Co | |
| Olievskiy Roman | $207,500 | None Available | |
| Ruelas Eufemio | $293,000 | Stewart Title |
Source: Public Records
Mortgage History
| Date | Status | Borrower | Loan Amount |
|---|---|---|---|
| Previous Owner | Ruelas Eufemio | $263,646 |
Source: Public Records
Tax History Compared to Growth
Tax History
| Year | Tax Paid | Tax Assessment Tax Assessment Total Assessment is a certain percentage of the fair market value that is determined by local assessors to be the total taxable value of land and additions on the property. | Land | Improvement |
|---|---|---|---|---|
| 2025 | $4,430 | $308,979 | $56,518 | $252,461 |
| 2024 | $4,430 | $302,921 | $55,410 | $247,511 |
| 2023 | $4,225 | $296,982 | $54,324 | $242,658 |
| 2022 | $4,127 | $291,159 | $53,259 | $237,900 |
| 2021 | $4,130 | $285,451 | $52,215 | $233,236 |
| 2020 | $4,859 | $282,525 | $51,680 | $230,845 |
| 2019 | $4,771 | $276,986 | $50,667 | $226,319 |
| 2018 | $4,509 | $271,556 | $49,674 | $221,882 |
| 2017 | $4,434 | $266,232 | $48,700 | $217,532 |
| 2016 | $4,367 | $261,013 | $47,746 | $213,267 |
| 2015 | $4,285 | $257,093 | $47,029 | $210,064 |
| 2014 | $4,101 | $252,058 | $46,108 | $205,950 |
Source: Public Records
Map
Nearby Homes
- 3353 Shearwater Dr
- 2327 Marina Glen Way
- 3361 Swallows Nest Ln
- 3207 Sweet Maple Way
- 3100 Swallows Nest Dr
- 3032 Swallows Nest Dr
- 3778 W River Dr
- 3014 Swallows Nest Dr
- 1395 Riverbank Rd
- 620 Smilax Ave
- 409 Star City St
- 637 Myrtle Ave
- 525 Water St Unit 5C956
- 2281 Garden Hwy
- 1025 Carrie St
- 904 Yolo St
- 1011 Waterford Dr
- 1008 Rogers St
- 3901 Westlake Dr Unit 123
- 1617 Lisbon Ave
- 17 Dunlin Ct
- 5 Dunlin Ct
- 2368 Marina Glen Way
- 2372 Marina Glen Way
- 23 Dunlin Ct
- 3369 Shearwater Dr
- 2364 Marina Glen Way
- 3373 Shearwater Dr
- 12 Dunlin Ct
- 6 Dunlin Ct
- 2376 Marina Glen Way
- 3365 Shearwater Dr
- 2360 Marina Glen Way
- 29 Dunlin Ct
- 3377 Shearwater Dr
- 3361 Shearwater Dr
- 2356 Marina Glen Way
- 2371 Marina Glen Way
- 2375 Marina Glen Way
- 3357 Shearwater Dr