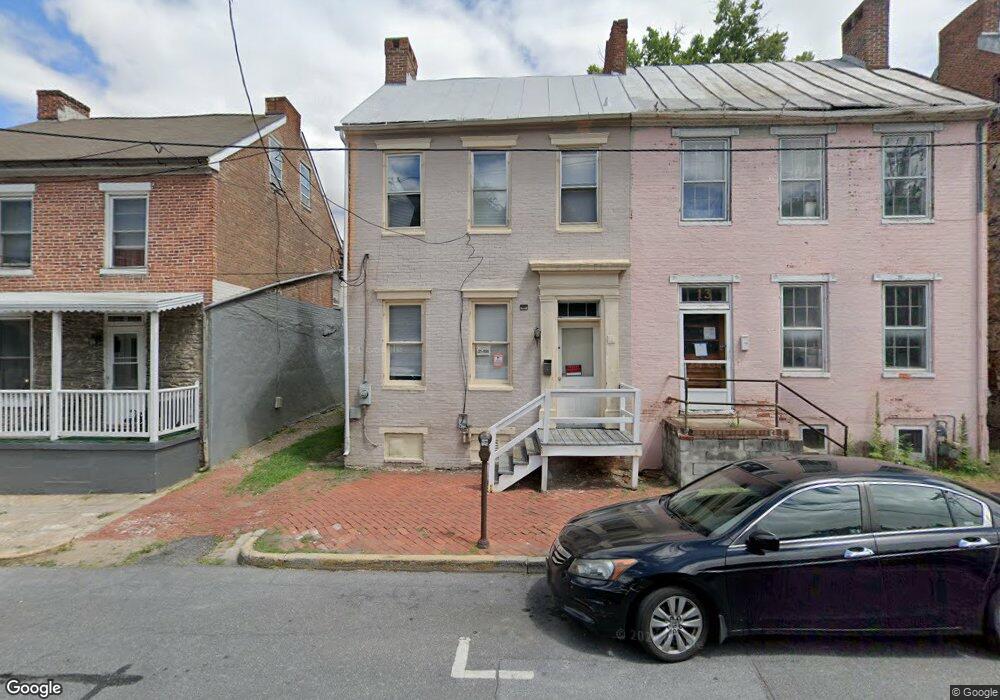
11 E All Saints St Frederick, MD 21701
Downtown Frederick NeighborhoodEstimated Value: $399,000 - $479,000
Studio
1
Bath
1,544
Sq Ft
$284/Sq Ft
Est. Value
About This Home
This home is located at 11 E All Saints St, Frederick, MD 21701 and is currently estimated at $438,094, approximately $283 per square foot. 11 E All Saints St is a home located in Frederick County with nearby schools including Spring Ridge Elementary School, Gov. Thomas Johnson Middle School, and Gov. Thomas Johnson High School.
Ownership History
Date
Name
Owned For
Owner Type
Purchase Details
Closed on
Dec 17, 2019
Sold by
K11 Llc
Bought by
11 East All Saints Street Llc
Current Estimated Value
Purchase Details
Closed on
Aug 21, 2017
Sold by
Kline John Ramsay and Kline Jennifer Praesel
Bought by
K11 Llc
Purchase Details
Closed on
Jul 15, 2016
Sold by
Equity 11 Llc
Bought by
Kline John Ramsay and Kline Jennifer Praesel
Purchase Details
Closed on
Nov 5, 2015
Sold by
Equity Ii Llc
Bought by
Kline John Ramsay and Kline Jennifer Praesel
Purchase Details
Closed on
Jun 6, 1985
Sold by
Kehne, Charles H Est Of
Bought by
Kline Richard R and Kline Margaret M
Home Financials for this Owner
Home Financials are based on the most recent Mortgage that was taken out on this home.
Original Mortgage
$135,000
Interest Rate
12.71%
Create a Home Valuation Report for This Property
The Home Valuation Report is an in-depth analysis detailing your home's value as well as a comparison with similar homes in the area
Home Values in the Area
Average Home Value in this Area
Purchase History
| Date | Buyer | Sale Price | Title Company |
|---|---|---|---|
| 11 East All Saints Street Llc | $259,995 | District Title A Corporation | |
| K11 Llc | -- | None Available | |
| Kline John Ramsay | $96,000 | Attorney | |
| Kline John Ramsay | $96,000 | Excalibur Title & Escrow Llc | |
| Kline Richard R | $165,000 | -- |
Source: Public Records
Mortgage History
| Date | Status | Borrower | Loan Amount |
|---|---|---|---|
| Previous Owner | Kline Richard R | $135,000 |
Source: Public Records
Tax History
| Year | Tax Paid | Tax Assessment Tax Assessment Total Assessment is a certain percentage of the fair market value that is determined by local assessors to be the total taxable value of land and additions on the property. | Land | Improvement |
|---|---|---|---|---|
| 2025 | $5,435 | $320,300 | $122,300 | $198,000 |
| 2024 | $5,435 | $291,733 | $0 | $0 |
| 2023 | $4,775 | $263,167 | $0 | $0 |
| 2022 | $4,251 | $234,600 | $102,300 | $132,300 |
| 2021 | $3,692 | $202,933 | $0 | $0 |
| 2020 | $3,118 | $171,267 | $0 | $0 |
| 2019 | $2,556 | $139,600 | $60,500 | $79,100 |
| 2018 | $2,447 | $137,200 | $0 | $0 |
| 2017 | $2,417 | $139,300 | $0 | $0 |
| 2016 | $2,519 | $132,100 | $0 | $0 |
| 2015 | $2,519 | $132,100 | $0 | $0 |
| 2014 | $2,519 | $132,100 | $0 | $0 |
Source: Public Records
Map
Nearby Homes
- 35 E All Saints St Unit 306
- 110 N Court St
- 200 E Church St
- 208 Broadway St
- 13 E 2nd St
- 210 E 2nd St Unit 402
- 210 E 2nd St Unit 401
- 208 E 2nd St
- 17 W 3rd St
- 203 E 3rd St
- 427 S Market St
- 15 E 4th St
- 23 W 4th St
- 426 Chapel Aly
- 418 N Maxwell Ave
- 209 Dill Ave
- 20 Maxwell Square
- 247 Dill Ave
- 38 E 6th St
- 229 E 5th St
- 46 S Market St Unit 46-48
- 46 S Market St
- 56 S Market St
- 52 S Market St
- 58 S Market St
- 44 S Market St
- 15 E All Saints St
- 9 E All Saints St
- 19 E All Saints St
- 38 S Market St
- 21 E All Saints St
- 36 S Market St
- 36S S Market St
- 72 S Market St
- 40 S Market St
- 35 E All Saints St Unit 310
- 35 E All Saints St Unit 4
- 35 E All Saints St Unit 221
- 35 E All Saints St Unit 307
- 35 E All Saints St Unit 208
Your Personal Tour Guide
Ask me questions while you tour the home.