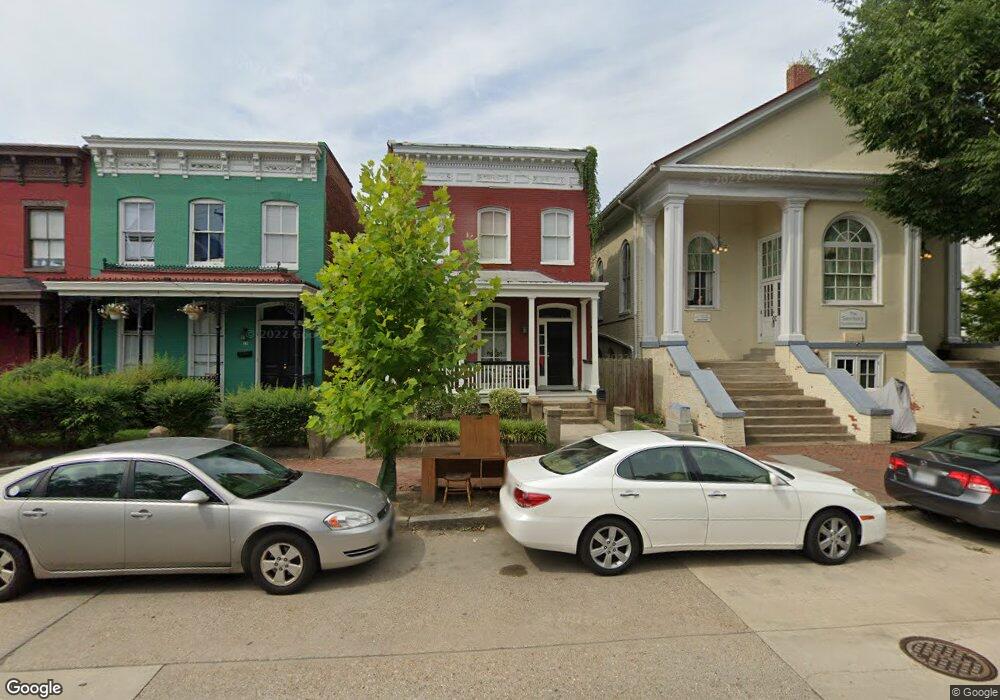
11 E Clay St Richmond, VA 23219
Jackson Ward NeighborhoodEstimated Value: $521,029 - $622,000
4
Beds
3
Baths
2,800
Sq Ft
$202/Sq Ft
Est. Value
About This Home
This home is located at 11 E Clay St, Richmond, VA 23219 and is currently estimated at $566,507, approximately $202 per square foot. 11 E Clay St is a home located in Richmond City with nearby schools including George W. Carver Elementary School, Albert Hill Middle, and Open High School.
Ownership History
Date
Name
Owned For
Owner Type
Purchase Details
Closed on
Aug 9, 2012
Sold by
Central Virginia Home Builder
Bought by
Hamm Jeffrey P
Current Estimated Value
Home Financials for this Owner
Home Financials are based on the most recent Mortgage that was taken out on this home.
Original Mortgage
$238,000
Outstanding Balance
$165,108
Interest Rate
3.7%
Mortgage Type
Construction
Estimated Equity
$401,399
Purchase Details
Closed on
Nov 13, 2006
Sold by
Seibert David
Bought by
Central Va Home Bldr Inc
Home Financials for this Owner
Home Financials are based on the most recent Mortgage that was taken out on this home.
Original Mortgage
$265,800
Interest Rate
6.33%
Mortgage Type
Construction
Purchase Details
Closed on
Apr 18, 2006
Sold by
The Trustee Fountain Deli
Bought by
Seibert David and Knight,Kevin
Create a Home Valuation Report for This Property
The Home Valuation Report is an in-depth analysis detailing your home's value as well as a comparison with similar homes in the area
Home Values in the Area
Average Home Value in this Area
Purchase History
| Date | Buyer | Sale Price | Title Company |
|---|---|---|---|
| Hamm Jeffrey P | $180,000 | -- | |
| Central Va Home Bldr Inc | $120,000 | -- | |
| Seibert David | $50,000 | -- |
Source: Public Records
Mortgage History
| Date | Status | Borrower | Loan Amount |
|---|---|---|---|
| Open | Hamm Jeffrey P | $238,000 | |
| Previous Owner | Central Va Home Bldr Inc | $265,800 |
Source: Public Records
Tax History Compared to Growth
Tax History
| Year | Tax Paid | Tax Assessment Tax Assessment Total Assessment is a certain percentage of the fair market value that is determined by local assessors to be the total taxable value of land and additions on the property. | Land | Improvement |
|---|---|---|---|---|
| 2025 | $5,136 | $428,000 | $95,000 | $333,000 |
| 2024 | $5,040 | $420,000 | $91,000 | $329,000 |
| 2023 | $4,644 | $387,000 | $70,000 | $317,000 |
| 2022 | $3,972 | $331,000 | $60,000 | $271,000 |
| 2021 | $3,072 | $279,000 | $50,000 | $229,000 |
| 2020 | $3,072 | $256,000 | $50,000 | $206,000 |
| 2019 | $4,511 | $239,000 | $50,000 | $189,000 |
| 2018 | $2,784 | $232,000 | $40,000 | $192,000 |
| 2017 | $2,712 | $226,000 | $40,000 | $186,000 |
| 2016 | $2,640 | $220,000 | $40,000 | $180,000 |
| 2015 | $2,700 | $213,000 | $40,000 | $173,000 |
| 2014 | $2,700 | $225,000 | $42,000 | $183,000 |
Source: Public Records
Map
Nearby Homes
- 110 W Marshall St Unit 25
- 101 W Marshall St Unit 12
- 214 W Marshall St
- 606 N 1st St
- 613 Price St
- 212 E Clay St Unit UB1
- 712 St James St
- 316 W Clay St
- 106 W Jackson St
- 212 W Franklin St Unit G3
- 212 W Franklin St Unit 102
- 501 Catherine St
- 212 E Franklin St Unit 2
- 1 E Main St
- Rowland Plan at Foushee Mews
- Park Plan at Foushee Mews
- Westmoreland Plan at Foushee Mews
- Davenport Plan at Foushee Mews
- 11 E Main St
- 705 1/2 W Leigh St