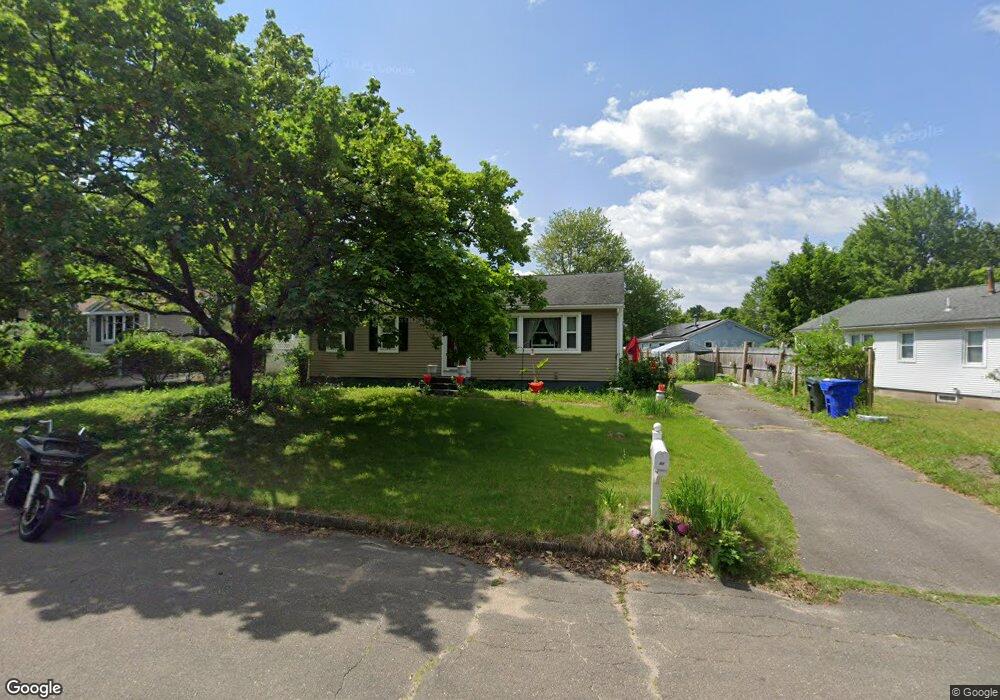
11 E Hill Rd Springfield, MA 01109
Sixteen Acres NeighborhoodEstimated Value: $233,000 - $295,000
3
Beds
1
Bath
960
Sq Ft
$276/Sq Ft
Est. Value
About This Home
This home is located at 11 E Hill Rd, Springfield, MA 01109 and is currently estimated at $264,644, approximately $275 per square foot. 11 E Hill Rd is a home located in Hampden County with nearby schools including Frank H. Freedman School, John J Duggan Middle, and Springfield High School of Science and Technology.
Ownership History
Date
Name
Owned For
Owner Type
Purchase Details
Closed on
Aug 28, 1987
Sold by
Polonsky Howard E
Bought by
Varner Diane
Current Estimated Value
Home Financials for this Owner
Home Financials are based on the most recent Mortgage that was taken out on this home.
Original Mortgage
$40,000
Interest Rate
10.24%
Mortgage Type
Purchase Money Mortgage
Create a Home Valuation Report for This Property
The Home Valuation Report is an in-depth analysis detailing your home's value as well as a comparison with similar homes in the area
Home Values in the Area
Average Home Value in this Area
Purchase History
| Date | Buyer | Sale Price | Title Company |
|---|---|---|---|
| Varner Diane | $79,000 | -- |
Source: Public Records
Mortgage History
| Date | Status | Borrower | Loan Amount |
|---|---|---|---|
| Closed | Varner Diane | $45,000 | |
| Closed | Varner Diane | $40,000 |
Source: Public Records
Tax History
| Year | Tax Paid | Tax Assessment Tax Assessment Total Assessment is a certain percentage of the fair market value that is determined by local assessors to be the total taxable value of land and additions on the property. | Land | Improvement |
|---|---|---|---|---|
| 2025 | $3,324 | $212,000 | $51,200 | $160,800 |
| 2024 | $3,243 | $201,900 | $51,200 | $150,700 |
| 2023 | $3,117 | $182,800 | $48,700 | $134,100 |
| 2022 | $2,576 | $136,900 | $48,700 | $88,200 |
| 2021 | $2,555 | $135,200 | $44,300 | $90,900 |
| 2020 | $2,344 | $120,000 | $44,300 | $75,700 |
| 2019 | $2,244 | $114,000 | $44,300 | $69,700 |
| 2018 | $2,094 | $106,400 | $44,300 | $62,100 |
| 2017 | $2,277 | $115,800 | $48,900 | $66,900 |
| 2016 | $2,104 | $107,000 | $48,900 | $58,100 |
| 2015 | $2,067 | $105,100 | $48,900 | $56,200 |
Source: Public Records
Map
Nearby Homes
Your Personal Tour Guide
Ask me questions while you tour the home.