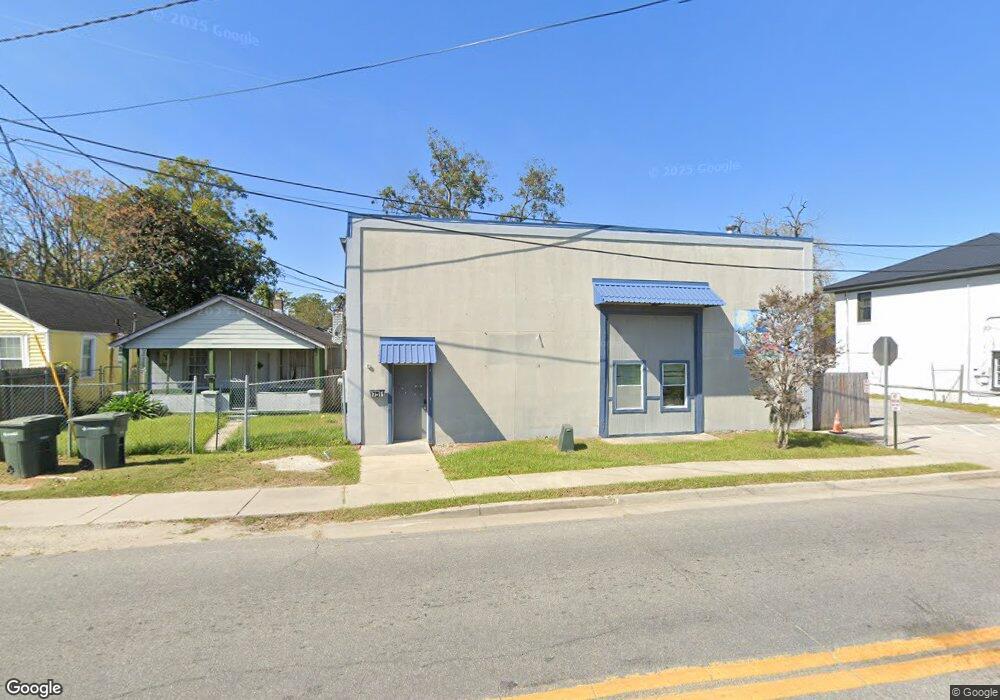
11 E Lathrop Ave Savannah, GA 31415
West Savannah NeighborhoodEstimated Value: $653,705
--
Bed
3
Baths
4,200
Sq Ft
$156/Sq Ft
Est. Value
About This Home
This home is located at 11 E Lathrop Ave, Savannah, GA 31415 and is currently estimated at $653,705, approximately $155 per square foot. 11 E Lathrop Ave is a home located in Chatham County with nearby schools including Otis J. Brock, III Elementary School, Mercer Middle School, and Groves High School.
Ownership History
Date
Name
Owned For
Owner Type
Purchase Details
Closed on
Jul 31, 2015
Sold by
Rte Mtd 11 Lathrop Spoke Llc
Bought by
Jordan Crossing Learning Academy Llc
Current Estimated Value
Home Financials for this Owner
Home Financials are based on the most recent Mortgage that was taken out on this home.
Original Mortgage
$311,100
Outstanding Balance
$221,042
Interest Rate
4.11%
Mortgage Type
Commercial
Estimated Equity
$432,663
Purchase Details
Closed on
Apr 7, 2010
Sold by
Vital Healthcare Llc
Bought by
Com Savannah For Sale By Owner
Purchase Details
Closed on
Jun 21, 2006
Sold by
Not Provided
Bought by
Savannah For Sale By Owner Com
Home Financials for this Owner
Home Financials are based on the most recent Mortgage that was taken out on this home.
Original Mortgage
$151,200
Interest Rate
6.55%
Mortgage Type
Commercial
Create a Home Valuation Report for This Property
The Home Valuation Report is an in-depth analysis detailing your home's value as well as a comparison with similar homes in the area
Home Values in the Area
Average Home Value in this Area
Purchase History
| Date | Buyer | Sale Price | Title Company |
|---|---|---|---|
| Jordan Crossing Learning Academy Llc | $325,000 | -- | |
| Com Savannah For Sale By Owner | -- | -- | |
| Savannah For Sale By Owner Com | $189,000 | -- |
Source: Public Records
Mortgage History
| Date | Status | Borrower | Loan Amount |
|---|---|---|---|
| Open | Jordan Crossing Learning Academy Llc | $311,100 | |
| Previous Owner | Savannah For Sale By Owner Com | $151,200 |
Source: Public Records
Tax History Compared to Growth
Tax History
| Year | Tax Paid | Tax Assessment Tax Assessment Total Assessment is a certain percentage of the fair market value that is determined by local assessors to be the total taxable value of land and additions on the property. | Land | Improvement |
|---|---|---|---|---|
| 2025 | $6,356 | $235,400 | $9,720 | $225,680 |
| 2024 | $6,356 | $235,520 | $9,720 | $225,800 |
| 2023 | $3,062 | $251,000 | $9,720 | $241,280 |
| 2022 | $2,645 | $216,800 | $9,720 | $207,080 |
| 2021 | $8,121 | $188,560 | $9,720 | $178,840 |
| 2020 | $5,999 | $190,000 | $9,720 | $180,280 |
| 2019 | $8,442 | $190,000 | $9,720 | $180,280 |
| 2018 | $3,894 | $123,320 | $9,720 | $113,600 |
| 2017 | $3,603 | $122,880 | $9,720 | $113,160 |
| 2016 | $3,514 | $120,440 | $7,280 | $113,160 |
| 2014 | $3,820 | $67,440 | $0 | $0 |
Source: Public Records
Map
Nearby Homes