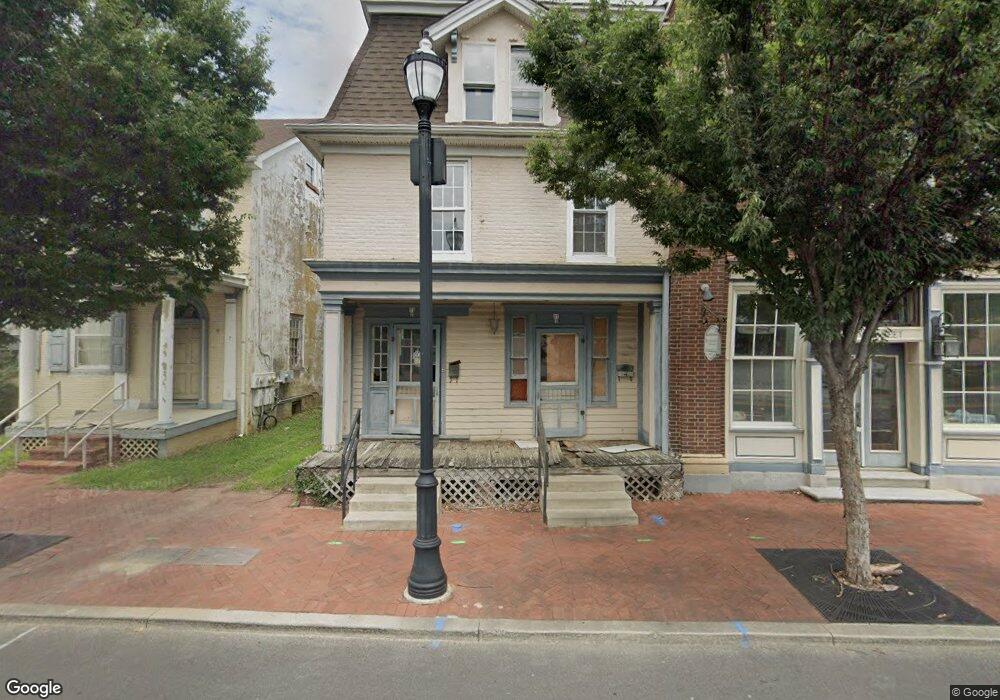
11 E Main St Middletown, DE 19709
Estimated Value: $319,569 - $472,000
6
Beds
4
Baths
3,514
Sq Ft
$114/Sq Ft
Est. Value
About This Home
This home is located at 11 E Main St, Middletown, DE 19709 and is currently estimated at $400,856, approximately $114 per square foot. 11 E Main St is a home located in New Castle County with nearby schools including Silver Lake Elementary School, Louis L. Redding Middle School, and Appoquinimink High School.
Ownership History
Date
Name
Owned For
Owner Type
Purchase Details
Closed on
Apr 25, 2023
Sold by
Cisneros Herminio
Bought by
Cisneros Investments Llc
Current Estimated Value
Purchase Details
Closed on
Apr 17, 2007
Sold by
Weidlein John E
Bought by
East Main Street Mercantile Llc
Home Financials for this Owner
Home Financials are based on the most recent Mortgage that was taken out on this home.
Original Mortgage
$600,000
Interest Rate
6.23%
Mortgage Type
Balloon
Create a Home Valuation Report for This Property
The Home Valuation Report is an in-depth analysis detailing your home's value as well as a comparison with similar homes in the area
Home Values in the Area
Average Home Value in this Area
Purchase History
| Date | Buyer | Sale Price | Title Company |
|---|---|---|---|
| Cisneros Investments Llc | -- | None Listed On Document | |
| Cisneros Herminio | -- | None Listed On Document | |
| East Main Street Mercantile Llc | $200,000 | None Available |
Source: Public Records
Mortgage History
| Date | Status | Borrower | Loan Amount |
|---|---|---|---|
| Previous Owner | East Main Street Mercantile Llc | $600,000 |
Source: Public Records
Tax History
| Year | Tax Paid | Tax Assessment Tax Assessment Total Assessment is a certain percentage of the fair market value that is determined by local assessors to be the total taxable value of land and additions on the property. | Land | Improvement |
|---|---|---|---|---|
| 2024 | $137 | $45,500 | $5,500 | $40,000 |
| 2023 | $137 | $45,500 | $5,500 | $40,000 |
| 2022 | $1,399 | $45,500 | $5,500 | $40,000 |
| 2021 | $1,680 | $45,500 | $5,500 | $40,000 |
| 2020 | $1,536 | $45,500 | $5,500 | $40,000 |
| 2019 | $1,390 | $45,500 | $5,500 | $40,000 |
| 2018 | $1,199 | $45,500 | $5,500 | $40,000 |
| 2017 | $1,154 | $45,500 | $5,500 | $40,000 |
| 2016 | $1,037 | $45,500 | $5,500 | $40,000 |
| 2015 | $1,140 | $45,500 | $5,500 | $40,000 |
| 2014 | $1,137 | $45,500 | $5,500 | $40,000 |
Source: Public Records
Map
Nearby Homes
- 129 E Main St
- 12 E Cochran St
- 14 W Lake St
- 113 Crawford St
- 108 E Cochran St
- 8 Redding Cir
- 11 E Lockwood St
- 11 W Hoffecker St
- 25 Franklin Dr
- 659 Warren Dr
- 60 S Cummings Dr
- 40 S Cummings Dr
- 610 Louis Ln
- 908 S Cass St
- 162 Liborio Dr
- 29 W Reybold Dr
- 447 Toftrees Dr
- 57 W Sarazen Dr
- 211 Lake Seymour Dr
- 264 Trellis Ln
- 7 E Main St
- 13 E Main St
- 2 E Main St
- 0 the Grove at Bayberry - Single Family Homes St Unit 36456522
- 0 the Grove at Bayberry - Single Family Homes St Unit 36479729
- 0 the Grove at Bayberry - Single Family Homes St Unit 36464540
- 0 the Grove at Bayberry - Single Family Homes St Unit 39053146
- 0 the Grove at Bayberry - Townhomes St Unit 36438869
- 0 the Grove at Bayberry - Townhomes St Unit 36456330
- 0 the Grove at Bayberry - Townhomes St Unit 36464540
- 0 the Grove at Bayberry - Townhomes St Unit 36497063
- 0 the Grove at Bayberry - Townhomes St Unit 36456522
- 0 the Grove at Bayberry - Townhomes St Unit 36479729
- 0 the Grove at Bayberry - Townhomes St Unit 36452678
- 0 the Grove at Bayberry St Unit 36456522
- 0 the Grove at Bayberry St Unit 36456330
- 0 the Grove at Bayberry St Unit 36464540
- 0 the Grove at Bayberry St Unit 36497063
- 0 the Grove at Bayberry St Unit 36438869
- 0 the Grove at Bayberry St Unit 36479729
Your Personal Tour Guide
Ask me questions while you tour the home.