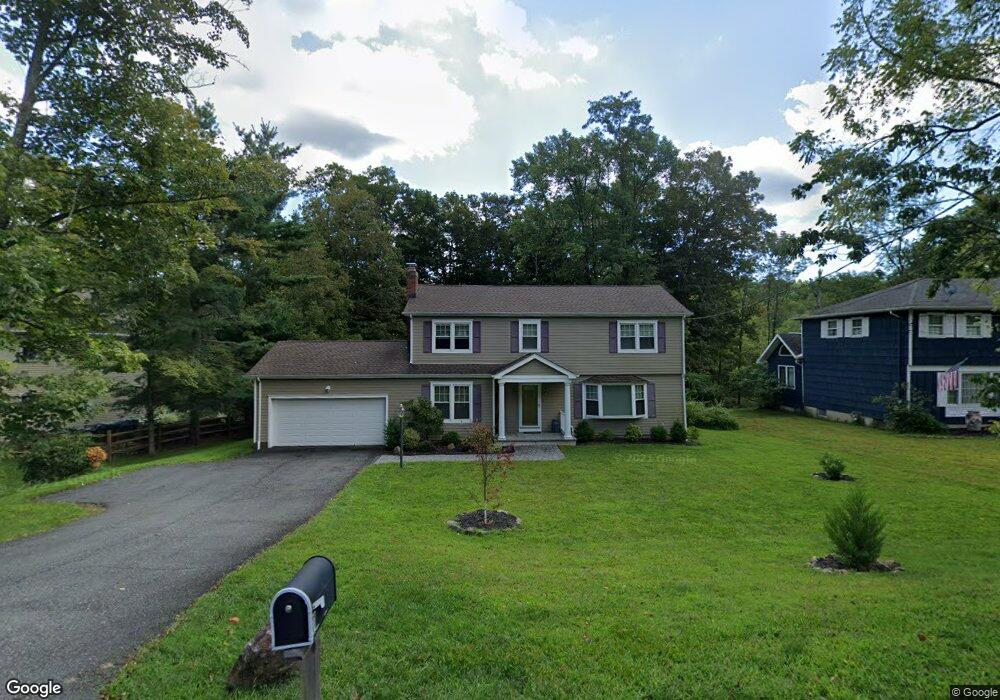
11 E Main St Morristown, NJ 07960
Estimated Value: $875,000 - $1,350,000
Studio
--
Bath
2,485
Sq Ft
$423/Sq Ft
Est. Value
About This Home
This home is located at 11 E Main St, Morristown, NJ 07960 and is currently estimated at $1,051,902, approximately $423 per square foot. 11 E Main St is a home located in Morris County with nearby schools including Mendham Township Elementary School, Mendham Township Middle School, and West Morris Mendham High School.
Ownership History
Date
Name
Owned For
Owner Type
Purchase Details
Closed on
Aug 8, 1999
Sold by
Wakefield Anthony Joseph and Wakefield Verity Jane
Bought by
Burleigh John A and Burleigh Graceanne
Current Estimated Value
Home Financials for this Owner
Home Financials are based on the most recent Mortgage that was taken out on this home.
Original Mortgage
$225,000
Outstanding Balance
$59,637
Interest Rate
7.6%
Mortgage Type
Stand Alone First
Estimated Equity
$992,265
Create a Home Valuation Report for This Property
The Home Valuation Report is an in-depth analysis detailing your home's value as well as a comparison with similar homes in the area
Home Values in the Area
Average Home Value in this Area
Purchase History
| Date | Buyer | Sale Price | Title Company |
|---|---|---|---|
| Burleigh John A | $342,500 | -- |
Source: Public Records
Mortgage History
| Date | Status | Borrower | Loan Amount |
|---|---|---|---|
| Open | Burleigh John A | $225,000 |
Source: Public Records
Tax History
| Year | Tax Paid | Tax Assessment Tax Assessment Total Assessment is a certain percentage of the fair market value that is determined by local assessors to be the total taxable value of land and additions on the property. | Land | Improvement |
|---|---|---|---|---|
| 2025 | $14,567 | $820,900 | $396,900 | $424,000 |
| 2024 | $14,567 | $750,100 | $346,000 | $404,100 |
| 2023 | $14,489 | $693,600 | $311,800 | $381,800 |
| 2022 | $12,448 | $675,600 | $304,500 | $371,100 |
| 2021 | $12,448 | $562,500 | $260,000 | $302,500 |
| 2020 | $12,369 | $562,500 | $260,000 | $302,500 |
| 2019 | $12,139 | $562,500 | $260,000 | $302,500 |
| 2018 | $11,908 | $562,500 | $260,000 | $302,500 |
| 2017 | $11,633 | $562,500 | $260,000 | $302,500 |
| 2016 | $11,616 | $562,500 | $260,000 | $302,500 |
| 2015 | $11,402 | $562,500 | $260,000 | $302,500 |
| 2014 | $11,143 | $562,500 | $260,000 | $302,500 |
Source: Public Records
Map
Nearby Homes
- 17 E Main St
- 13 Knollwood Trail E
- 6 Thackery Ln
- 26 Woodland Rd
- 1 Southern Slope Terrace
- 6 Cold Hill Rd
- 39 Woodland Rd
- 8 Franklin Dr
- 4 Ascot Ln
- 47 Woodland Rd
- 3 Old Orchard Terrace
- 56 Woodland Rd
- 67 Hampshire Dr
- 16 Galway Dr
- 20 Mount Pleasant Rd
- 20 Mount Pleasant Rd
- 41 Franklin Rd
- 52 Schoolhouse Ln
- 267 Washington Valley Rd
- 5 Albert Ct
Your Personal Tour Guide
Ask me questions while you tour the home.