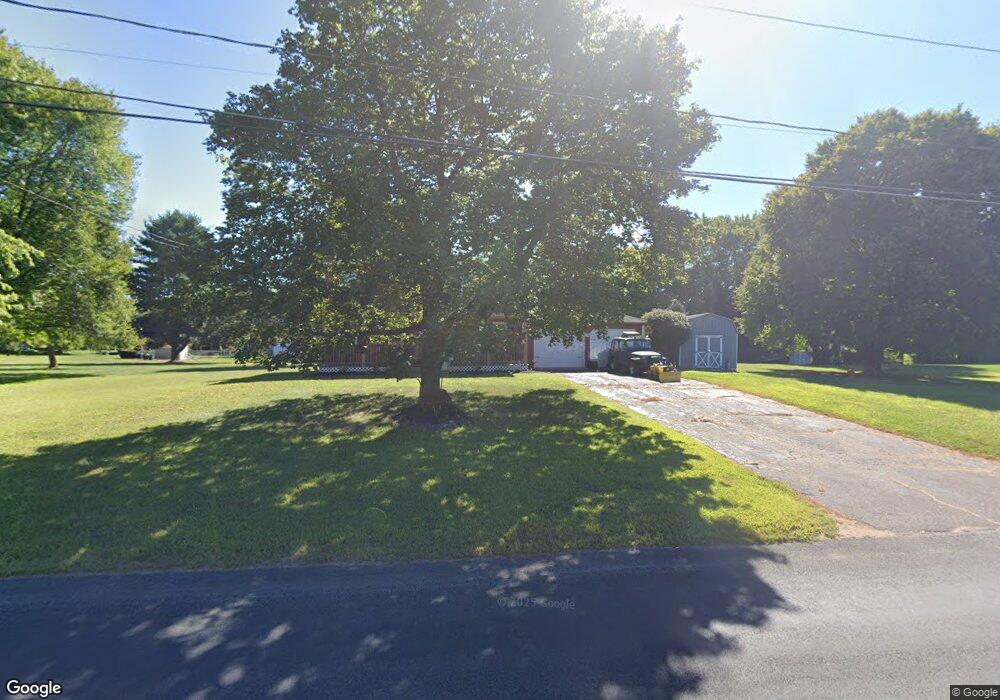
11 East Rd Unit 11 E Broad Brook, CT 06016
Estimated Value: $378,000 - $395,208
2
Beds
6
Baths
1,700
Sq Ft
$229/Sq Ft
Est. Value
About This Home
This home is located at 11 East Rd Unit 11 E, Broad Brook, CT 06016 and is currently estimated at $389,302, approximately $229 per square foot. 11 East Rd Unit 11 E is a home located in Hartford County with nearby schools including Broad Brook Elementary School, East Windsor Middle School, and East Windsor High School.
Ownership History
Date
Name
Owned For
Owner Type
Purchase Details
Closed on
May 31, 2019
Sold by
Sibley Joyce Ann Est
Bought by
Hunt Brandon R
Current Estimated Value
Home Financials for this Owner
Home Financials are based on the most recent Mortgage that was taken out on this home.
Original Mortgage
$196,969
Outstanding Balance
$173,184
Interest Rate
4.1%
Mortgage Type
Purchase Money Mortgage
Estimated Equity
$216,118
Create a Home Valuation Report for This Property
The Home Valuation Report is an in-depth analysis detailing your home's value as well as a comparison with similar homes in the area
Home Values in the Area
Average Home Value in this Area
Purchase History
| Date | Buyer | Sale Price | Title Company |
|---|---|---|---|
| Hunt Brandon R | $195,000 | -- |
Source: Public Records
Mortgage History
| Date | Status | Borrower | Loan Amount |
|---|---|---|---|
| Open | Hunt Brandon R | $196,969 | |
| Previous Owner | Hunt Brandon R | $347,500 | |
| Previous Owner | Hunt Brandon R | $10,000 |
Source: Public Records
Tax History Compared to Growth
Tax History
| Year | Tax Paid | Tax Assessment Tax Assessment Total Assessment is a certain percentage of the fair market value that is determined by local assessors to be the total taxable value of land and additions on the property. | Land | Improvement |
|---|---|---|---|---|
| 2025 | $5,392 | $203,560 | $53,120 | $150,440 |
| 2024 | $4,999 | $203,560 | $53,120 | $150,440 |
| 2023 | $4,281 | $124,870 | $49,270 | $75,600 |
| 2022 | $4,732 | $124,870 | $49,270 | $75,600 |
| 2021 | $4,308 | $124,870 | $49,270 | $75,600 |
| 2020 | $4,268 | $122,940 | $49,270 | $73,670 |
| 2019 | $4,211 | $122,940 | $49,270 | $73,670 |
| 2018 | $4,168 | $122,940 | $49,270 | $73,670 |
| 2017 | $3,989 | $121,740 | $57,380 | $64,360 |
| 2016 | $3,765 | $121,740 | $57,380 | $64,360 |
| 2015 | $3,527 | $116,360 | $57,380 | $58,980 |
| 2014 | $3,465 | $116,360 | $57,380 | $58,980 |
Source: Public Records
Map
Nearby Homes