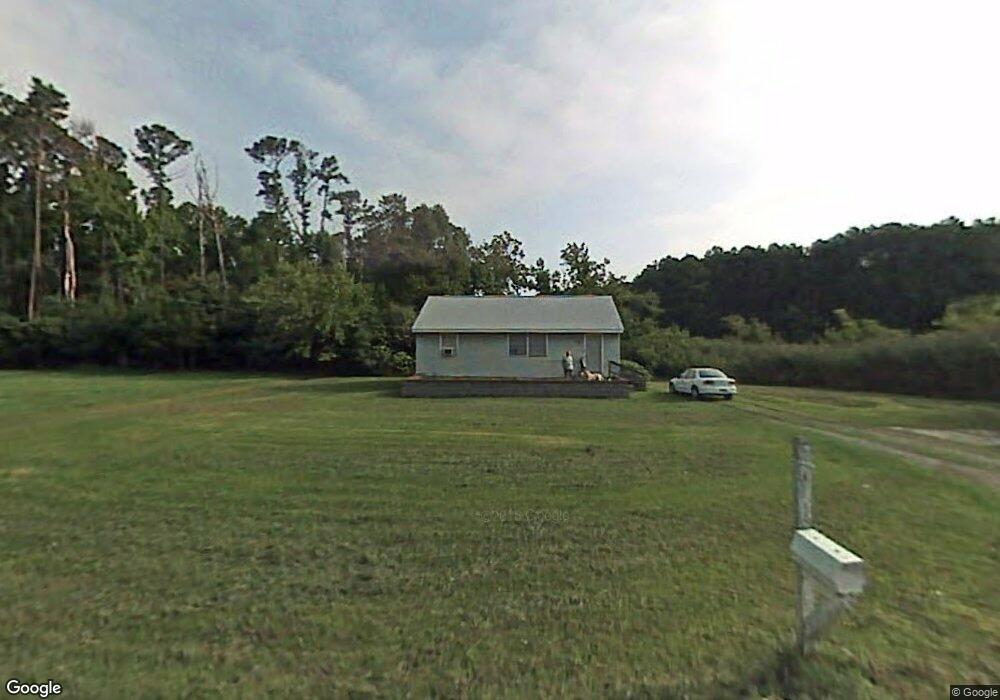
11 Edmonds Cove Rd Hampton, VA 23664
Fox Hill NeighborhoodEstimated Value: $274,000 - $312,000
2
Beds
1
Bath
1,069
Sq Ft
$274/Sq Ft
Est. Value
About This Home
This home is located at 11 Edmonds Cove Rd, Hampton, VA 23664 and is currently estimated at $293,215, approximately $274 per square foot. 11 Edmonds Cove Rd is a home located in Hampton City with nearby schools including Francis Asbury Elementary School, Benjamin Syms Middle School, and Kecoughtan High School.
Ownership History
Date
Name
Owned For
Owner Type
Purchase Details
Closed on
Sep 30, 2016
Sold by
Vanvancrane Sonya Van
Bought by
Payne James Daniel and Crane Sonya Van
Current Estimated Value
Purchase Details
Closed on
Jun 30, 2016
Sold by
Mortgage Equity Coversion Asset Trust 20
Bought by
Crane Sonya
Purchase Details
Closed on
Mar 10, 2016
Sold by
Commonwealth Trustees Llc Substitute Tru and Tappen Kenneth
Bought by
Mortgage Equity Conversion Asset Trust 2
Create a Home Valuation Report for This Property
The Home Valuation Report is an in-depth analysis detailing your home's value as well as a comparison with similar homes in the area
Home Values in the Area
Average Home Value in this Area
Purchase History
| Date | Buyer | Sale Price | Title Company |
|---|---|---|---|
| Payne James Daniel | -- | None Available | |
| Crane Sonya | $55,000 | Sutton Land Title Agency | |
| Mortgage Equity Conversion Asset Trust 2 | $84,000 | None Available |
Source: Public Records
Tax History
| Year | Tax Paid | Tax Assessment Tax Assessment Total Assessment is a certain percentage of the fair market value that is determined by local assessors to be the total taxable value of land and additions on the property. | Land | Improvement |
|---|---|---|---|---|
| 2025 | $3,187 | $271,800 | $42,800 | $229,000 |
| 2024 | $2,980 | $259,100 | $42,800 | $216,300 |
| 2023 | $2,908 | $250,700 | $42,800 | $207,900 |
| 2022 | $2,464 | $208,800 | $42,800 | $166,000 |
| 2021 | $2,405 | $183,500 | $42,800 | $140,700 |
| 2020 | $2,009 | $162,000 | $42,800 | $119,200 |
| 2019 | $2,009 | $162,000 | $42,800 | $119,200 |
| 2018 | $1,098 | $114,700 | $42,800 | $71,900 |
| 2017 | $1,516 | $0 | $0 | $0 |
| 2016 | $1,276 | $95,300 | $0 | $0 |
| 2015 | $94 | $0 | $0 | $0 |
| 2014 | $84 | $95,300 | $42,800 | $52,500 |
Source: Public Records
Map
Nearby Homes
Your Personal Tour Guide
Ask me questions while you tour the home.