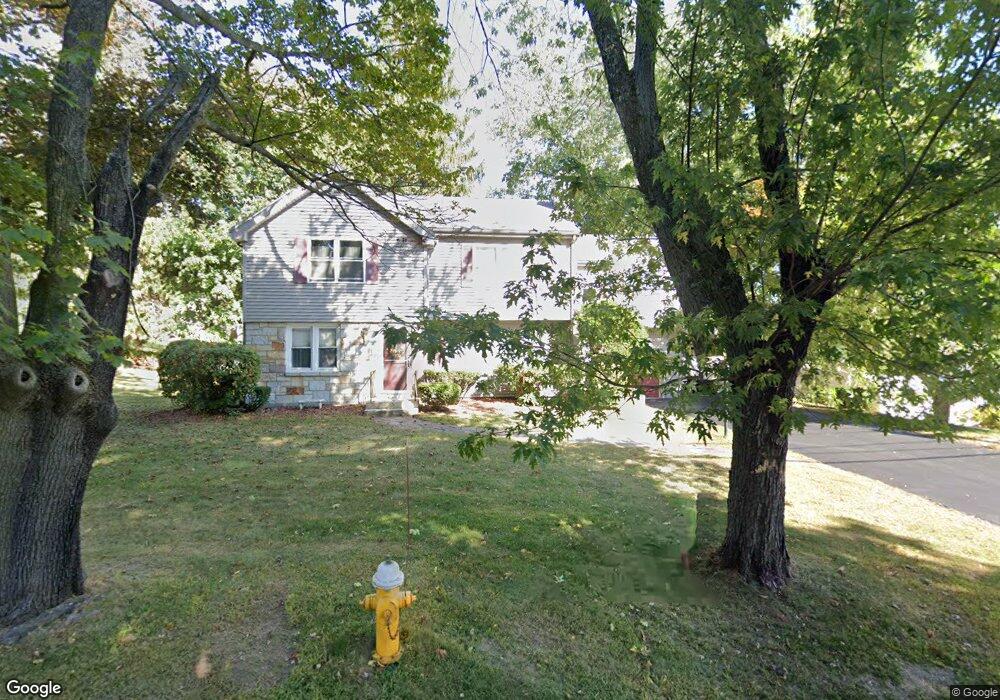
11 Ellie Way Worcester, MA 01610
College Hill NeighborhoodEstimated Value: $621,000 - $724,359
4
Beds
3
Baths
2,810
Sq Ft
$243/Sq Ft
Est. Value
About This Home
This home is located at 11 Ellie Way, Worcester, MA 01610 and is currently estimated at $683,340, approximately $243 per square foot. 11 Ellie Way is a home located in Worcester County with nearby schools including Jacob Hiatt Magnet School, Chandler Magnet, and Heard Street Discovery Academy.
Ownership History
Date
Name
Owned For
Owner Type
Purchase Details
Closed on
May 24, 2021
Sold by
Barbosa Enio and Rodriguez Ana C
Bought by
Drohan Peter W
Current Estimated Value
Home Financials for this Owner
Home Financials are based on the most recent Mortgage that was taken out on this home.
Original Mortgage
$510,000
Outstanding Balance
$462,187
Interest Rate
3.1%
Mortgage Type
Purchase Money Mortgage
Estimated Equity
$221,153
Purchase Details
Closed on
Jun 15, 2007
Sold by
Panarelli Joseph and Panarelli Maria G
Bought by
Barbosa Enio
Home Financials for this Owner
Home Financials are based on the most recent Mortgage that was taken out on this home.
Original Mortgage
$281,250
Interest Rate
6.19%
Mortgage Type
Purchase Money Mortgage
Create a Home Valuation Report for This Property
The Home Valuation Report is an in-depth analysis detailing your home's value as well as a comparison with similar homes in the area
Home Values in the Area
Average Home Value in this Area
Purchase History
| Date | Buyer | Sale Price | Title Company |
|---|---|---|---|
| Drohan Peter W | $538,000 | None Available | |
| Barbosa Enio | $125,000 | -- |
Source: Public Records
Mortgage History
| Date | Status | Borrower | Loan Amount |
|---|---|---|---|
| Open | Drohan Peter W | $510,000 | |
| Previous Owner | Barbosa Enio | $281,250 |
Source: Public Records
Tax History Compared to Growth
Tax History
| Year | Tax Paid | Tax Assessment Tax Assessment Total Assessment is a certain percentage of the fair market value that is determined by local assessors to be the total taxable value of land and additions on the property. | Land | Improvement |
|---|---|---|---|---|
| 2025 | $8,513 | $645,400 | $119,300 | $526,100 |
| 2024 | $8,429 | $613,000 | $119,300 | $493,700 |
| 2023 | $8,246 | $575,000 | $103,700 | $471,300 |
| 2022 | $7,780 | $511,500 | $82,900 | $428,600 |
| 2021 | $7,788 | $478,400 | $66,400 | $412,000 |
| 2020 | $7,244 | $426,100 | $66,300 | $359,800 |
| 2019 | $7,276 | $404,200 | $59,900 | $344,300 |
| 2018 | $7,169 | $379,100 | $59,900 | $319,200 |
| 2017 | $7,019 | $365,200 | $59,900 | $305,300 |
| 2016 | $7,209 | $349,800 | $45,200 | $304,600 |
| 2015 | $7,020 | $349,800 | $45,200 | $304,600 |
| 2014 | $6,835 | $349,800 | $45,200 | $304,600 |
Source: Public Records
Map
Nearby Homes