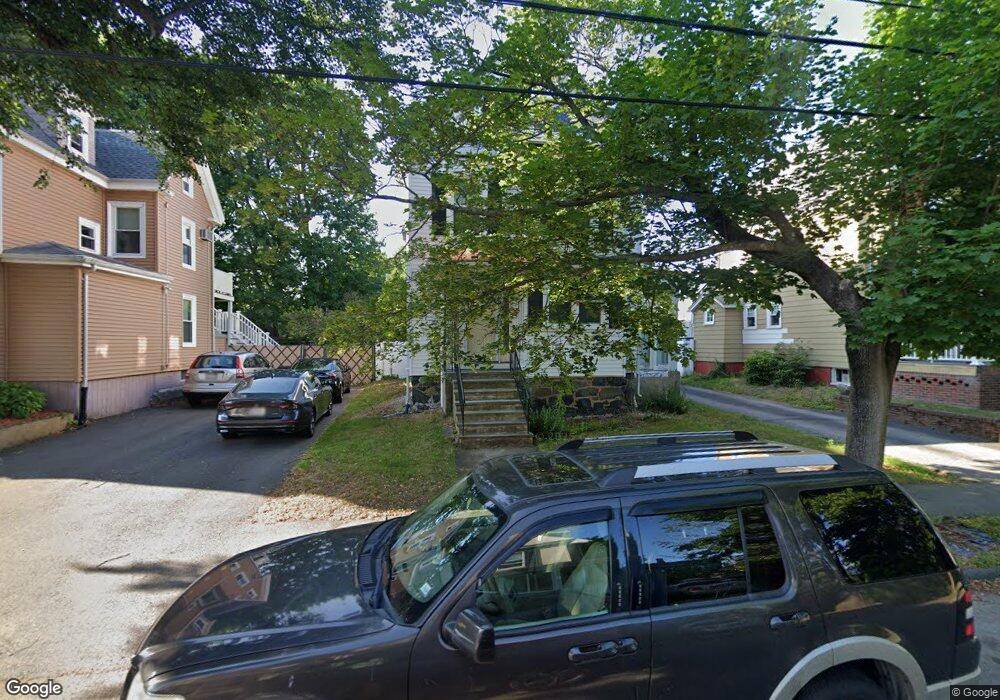
11 Emory St Saugus, MA 01906
Downtown Saugus NeighborhoodEstimated Value: $710,617 - $777,000
3
Beds
2
Baths
1,935
Sq Ft
$380/Sq Ft
Est. Value
About This Home
This home is located at 11 Emory St, Saugus, MA 01906 and is currently estimated at $735,154, approximately $379 per square foot. 11 Emory St is a home located in Essex County with nearby schools including Saugus High School, Pioneer Charter School Of Science II, and Sacred Heart School.
Ownership History
Date
Name
Owned For
Owner Type
Purchase Details
Closed on
Oct 1, 2008
Sold by
Washington Mutual Bk
Bought by
Lawrence Adeyemi
Current Estimated Value
Home Financials for this Owner
Home Financials are based on the most recent Mortgage that was taken out on this home.
Original Mortgage
$229,500
Outstanding Balance
$153,416
Interest Rate
6.54%
Mortgage Type
Purchase Money Mortgage
Estimated Equity
$581,738
Purchase Details
Closed on
May 1, 2008
Sold by
Marquez Theresa B
Bought by
Washington Mutual Bk
Purchase Details
Closed on
Aug 25, 2006
Sold by
Flores Carlos and Arreaga Melva
Bought by
Marquez Theresa B
Purchase Details
Closed on
Jan 27, 2004
Sold by
Beraldi Gene A and Beraldi Rebecca
Bought by
Flores Carlos
Purchase Details
Closed on
Dec 29, 1999
Sold by
Kelley Janet L and Kelley Frederick J
Bought by
Beraldi Gene A and Beraldi Rebecca
Create a Home Valuation Report for This Property
The Home Valuation Report is an in-depth analysis detailing your home's value as well as a comparison with similar homes in the area
Home Values in the Area
Average Home Value in this Area
Purchase History
| Date | Buyer | Sale Price | Title Company |
|---|---|---|---|
| Lawrence Adeyemi | $255,000 | -- | |
| Washington Mutual Bk | $255,000 | -- | |
| Marquez Theresa B | $525,000 | -- | |
| Flores Carlos | $394,900 | -- | |
| Beraldi Gene A | $252,000 | -- |
Source: Public Records
Mortgage History
| Date | Status | Borrower | Loan Amount |
|---|---|---|---|
| Open | Beraldi Gene A | $229,500 |
Source: Public Records
Tax History
| Year | Tax Paid | Tax Assessment Tax Assessment Total Assessment is a certain percentage of the fair market value that is determined by local assessors to be the total taxable value of land and additions on the property. | Land | Improvement |
|---|---|---|---|---|
| 2025 | $6,669 | $624,400 | $316,400 | $308,000 |
| 2024 | $6,477 | $608,200 | $307,800 | $300,400 |
| 2023 | $6,335 | $562,600 | $269,300 | $293,300 |
| 2022 | $6,150 | $512,100 | $250,500 | $261,600 |
| 2021 | $5,569 | $451,300 | $207,800 | $243,500 |
| 2020 | $5,147 | $431,800 | $197,500 | $234,300 |
| 2019 | $5,142 | $422,200 | $188,100 | $234,100 |
| 2018 | $4,651 | $401,600 | $179,600 | $222,000 |
| 2017 | $4,413 | $366,200 | $171,000 | $195,200 |
| 2016 | $4,363 | $357,600 | $162,400 | $195,200 |
| 2015 | $3,592 | $298,800 | $154,700 | $144,100 |
| 2014 | $3,622 | $312,000 | $154,700 | $157,300 |
Source: Public Records
Map
Nearby Homes
Your Personal Tour Guide
Ask me questions while you tour the home.