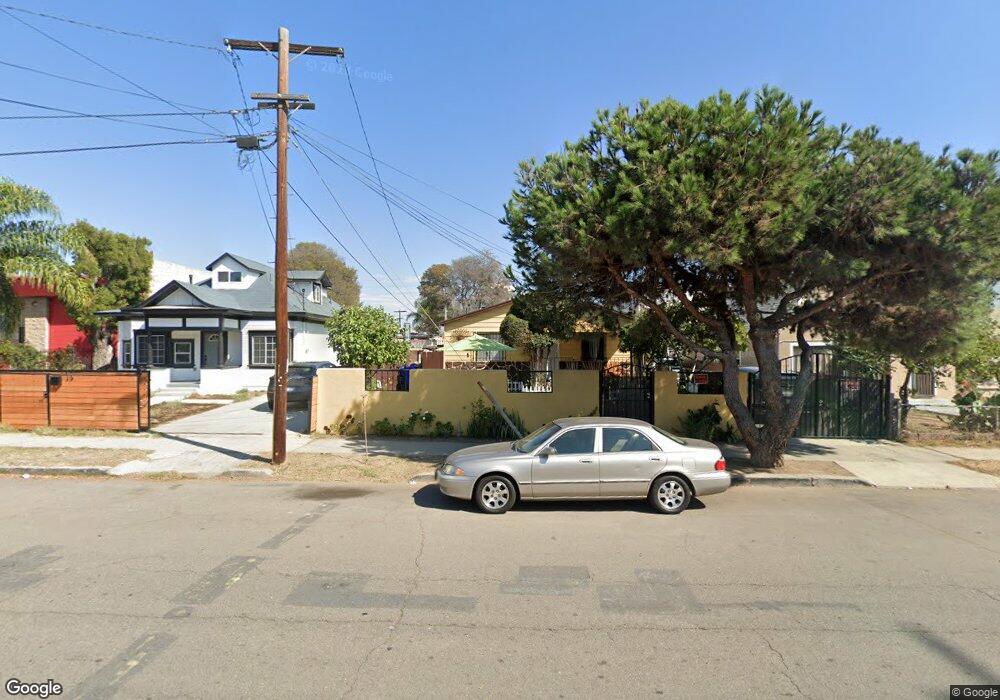
11 Evans St San Diego, CA 92102
Logan Heights NeighborhoodEstimated Value: $666,000 - $777,839
3
Beds
1
Bath
1,248
Sq Ft
$570/Sq Ft
Est. Value
About This Home
This home is located at 11 Evans St, San Diego, CA 92102 and is currently estimated at $710,960, approximately $569 per square foot. 11 Evans St is a home located in San Diego County with nearby schools including Burbank Elementary School, Logan Memorial Educational Campus, and King-Chavez Academy Of Excellence.
Ownership History
Date
Name
Owned For
Owner Type
Purchase Details
Closed on
May 12, 2004
Sold by
Romo Rogelio and Romo Guadalupe
Bought by
Romo Rogelio and Romo Guadalupe
Current Estimated Value
Home Financials for this Owner
Home Financials are based on the most recent Mortgage that was taken out on this home.
Original Mortgage
$112,000
Outstanding Balance
$53,508
Interest Rate
5.77%
Mortgage Type
Stand Alone Refi Refinance Of Original Loan
Estimated Equity
$657,452
Purchase Details
Closed on
Oct 5, 1999
Sold by
Guerrero David M and Guerrero Esperanza M
Bought by
Romo Rogelio and Romo Guadalupe
Home Financials for this Owner
Home Financials are based on the most recent Mortgage that was taken out on this home.
Original Mortgage
$88,800
Interest Rate
9.7%
Create a Home Valuation Report for This Property
The Home Valuation Report is an in-depth analysis detailing your home's value as well as a comparison with similar homes in the area
Home Values in the Area
Average Home Value in this Area
Purchase History
| Date | Buyer | Sale Price | Title Company |
|---|---|---|---|
| Romo Rogelio | -- | North American Title Co | |
| Romo Rogelio | $111,000 | Chicago Title Co |
Source: Public Records
Mortgage History
| Date | Status | Borrower | Loan Amount |
|---|---|---|---|
| Open | Romo Rogelio | $112,000 | |
| Previous Owner | Romo Rogelio | $88,800 | |
| Closed | Romo Rogelio | $16,650 |
Source: Public Records
Tax History
| Year | Tax Paid | Tax Assessment Tax Assessment Total Assessment is a certain percentage of the fair market value that is determined by local assessors to be the total taxable value of land and additions on the property. | Land | Improvement |
|---|---|---|---|---|
| 2025 | $3,287 | $244,617 | $176,745 | $67,872 |
| 2024 | $3,287 | $239,822 | $173,280 | $66,542 |
| 2023 | $3,202 | $235,121 | $169,883 | $65,238 |
| 2022 | $3,100 | $230,511 | $166,552 | $63,959 |
| 2021 | $3,063 | $225,992 | $163,287 | $62,705 |
| 2020 | $3,029 | $223,676 | $161,613 | $62,063 |
| 2019 | $2,980 | $219,292 | $158,445 | $60,847 |
| 2018 | $2,807 | $214,993 | $155,339 | $59,654 |
| 2017 | $2,747 | $210,779 | $152,294 | $58,485 |
| 2016 | $2,706 | $206,647 | $149,308 | $57,339 |
| 2015 | $2,670 | $203,544 | $147,066 | $56,478 |
| 2014 | $2,616 | $199,558 | $144,186 | $55,372 |
Source: Public Records
Map
Nearby Homes
- 2711 Imperial Ave
- 2146 Franklin Ave
- 2146 Franklin Ave Unit 12
- 2823 Webster Ave
- 2557-59 Imperial Ave
- 2567-69 L St
- 311-13 28th St
- 2946 Commercial St
- 244 26th St
- 2057 Harrison Ave Unit 59
- 2802 Ocean View Blvd
- 2948 Franklin Ave
- 2925 Franklin Ave
- 2629 Island Ave
- 0 J St Unit NDP2509260
- 1952 Irving Ave
- 325 S 30th St
- 2762 Market St
- 1859 Irving Ave
- 918-32 27th St Unit 918-32