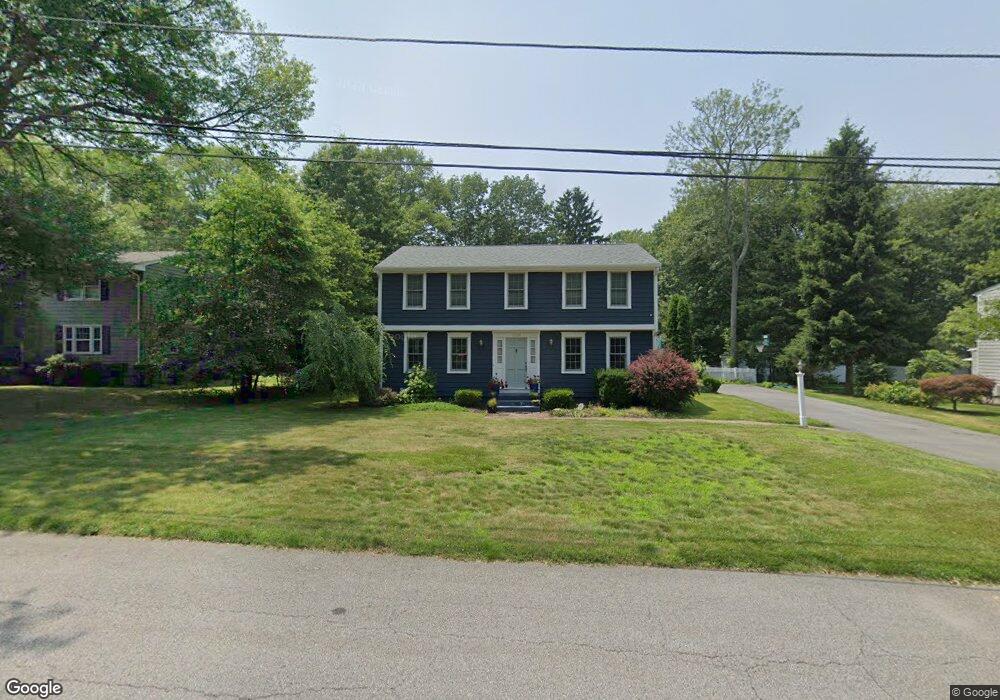
11 Fesser Ave Bristol, RI 02809
Downtown Bristol NeighborhoodEstimated Value: $804,455 - $985,000
4
Beds
3
Baths
2,188
Sq Ft
$413/Sq Ft
Est. Value
About This Home
This home is located at 11 Fesser Ave, Bristol, RI 02809 and is currently estimated at $903,614, approximately $412 per square foot. 11 Fesser Ave is a home located in Bristol County with nearby schools including Mt. Hope High School and Our Lady of Mt. Carmel School.
Ownership History
Date
Name
Owned For
Owner Type
Purchase Details
Closed on
Oct 22, 2010
Sold by
Cupolo John Est
Bought by
Burns Zachary and Burns Martha
Current Estimated Value
Home Financials for this Owner
Home Financials are based on the most recent Mortgage that was taken out on this home.
Original Mortgage
$284,000
Outstanding Balance
$187,601
Interest Rate
4.37%
Mortgage Type
Purchase Money Mortgage
Estimated Equity
$716,013
Create a Home Valuation Report for This Property
The Home Valuation Report is an in-depth analysis detailing your home's value as well as a comparison with similar homes in the area
Home Values in the Area
Average Home Value in this Area
Purchase History
| Date | Buyer | Sale Price | Title Company |
|---|---|---|---|
| Burns Zachary | $355,000 | -- |
Source: Public Records
Mortgage History
| Date | Status | Borrower | Loan Amount |
|---|---|---|---|
| Open | Burns Zachary | $37,000 | |
| Open | Burns Zachary | $284,000 | |
| Previous Owner | Burns Zachary | $325,000 | |
| Previous Owner | Burns Zachary | $250,000 |
Source: Public Records
Tax History Compared to Growth
Tax History
| Year | Tax Paid | Tax Assessment Tax Assessment Total Assessment is a certain percentage of the fair market value that is determined by local assessors to be the total taxable value of land and additions on the property. | Land | Improvement |
|---|---|---|---|---|
| 2025 | $6,155 | $445,400 | $181,100 | $264,300 |
| 2024 | $6,155 | $445,400 | $181,100 | $264,300 |
| 2023 | $5,951 | $445,400 | $181,100 | $264,300 |
| 2022 | $5,790 | $445,400 | $181,100 | $264,300 |
| 2021 | $5,851 | $406,900 | $191,400 | $215,500 |
| 2020 | $5,725 | $406,900 | $191,400 | $215,500 |
| 2019 | $5,583 | $406,900 | $191,400 | $215,500 |
| 2018 | $5,472 | $355,800 | $151,200 | $204,600 |
| 2017 | $4,961 | $332,500 | $128,900 | $203,600 |
| 2016 | $4,911 | $332,500 | $128,900 | $203,600 |
| 2015 | $4,665 | $332,500 | $128,900 | $203,600 |
| 2014 | $4,591 | $351,500 | $165,000 | $186,500 |
Source: Public Records
Map
Nearby Homes
- 60 Van Wickle Ln
- 38 Collins St
- 50 Charles St
- 82 Charles St
- 53 Catherine St
- 48 Constitution St Unit 2
- 48 Constitution St Unit 1
- 17 Rock St
- 18 State St Unit 5 (3rd Floor East)
- 291 High St
- 22 Magnolia St
- 341 Thames St Unit 109
- 44 Bradford St Unit 48
- 44 Bradford St Unit 49
- 44 Bradford St Unit 52
- 21 Bradford St Unit 2
- 214 Franklin St
- 2 Chilton St
- 2 Wilson St
- 107 Franklin St