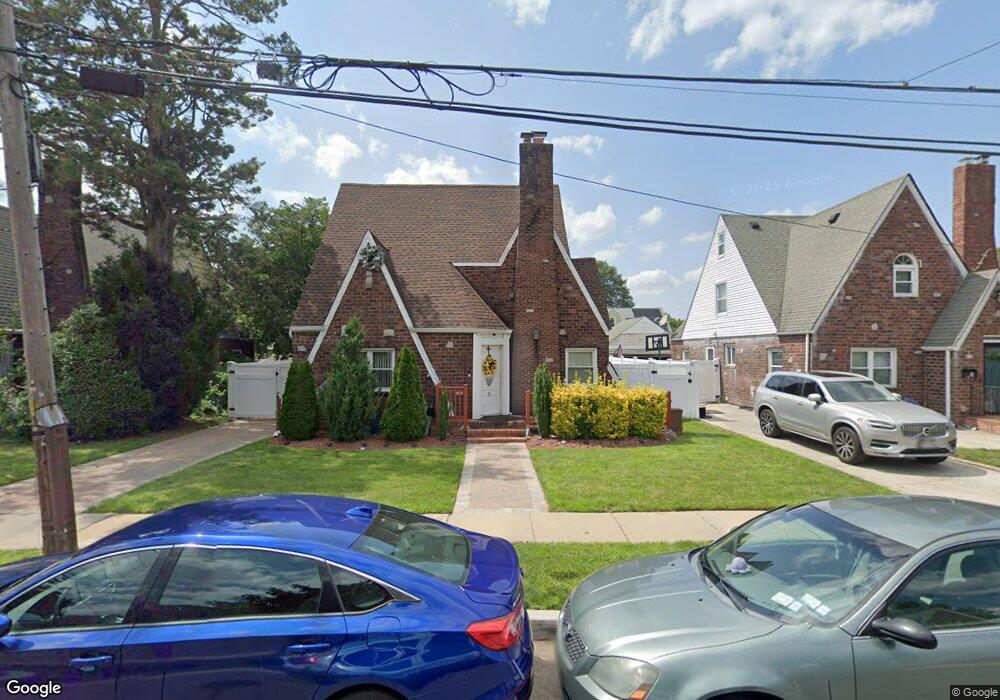
11 Flint Ave Hempstead, NY 11550
Estimated Value: $619,000 - $690,329
5
Beds
2
Baths
1,877
Sq Ft
$349/Sq Ft
Est. Value
About This Home
This home is located at 11 Flint Ave, Hempstead, NY 11550 and is currently estimated at $654,665, approximately $348 per square foot. 11 Flint Ave is a home located in Nassau County with nearby schools including Grand Avenue Elementary School, Lawrence Road Middle School, and Uniondale High School.
Ownership History
Date
Name
Owned For
Owner Type
Purchase Details
Closed on
Mar 26, 2019
Sold by
M I M Properties Inc
Bought by
Browne Corretta N and Browne Justin G
Current Estimated Value
Home Financials for this Owner
Home Financials are based on the most recent Mortgage that was taken out on this home.
Original Mortgage
$417,302
Outstanding Balance
$366,132
Interest Rate
4.3%
Mortgage Type
FHA
Estimated Equity
$288,533
Purchase Details
Closed on
Jun 20, 2018
Sold by
Hsbc Bank Usa Na
Bought by
M I M Properties Inc
Home Financials for this Owner
Home Financials are based on the most recent Mortgage that was taken out on this home.
Original Mortgage
$217,000
Interest Rate
4.6%
Mortgage Type
Commercial
Purchase Details
Closed on
Aug 22, 2012
Sold by
Grenne Samuel S and Greene Rennee M
Bought by
Hsbc Bank Usa Na
Create a Home Valuation Report for This Property
The Home Valuation Report is an in-depth analysis detailing your home's value as well as a comparison with similar homes in the area
Home Values in the Area
Average Home Value in this Area
Purchase History
| Date | Buyer | Sale Price | Title Company |
|---|---|---|---|
| Browne Corretta N | $425,000 | Wfg National Title | |
| Browne Corretta N | $425,000 | Wfg National Title | |
| M I M Properties Inc | $229,500 | Fidelity National Title | |
| M I M Properties Inc | $229,500 | Fidelity National Title | |
| Hsbc Bank Usa Na | $259,372 | -- | |
| Hsbc Bank Usa Na | $259,372 | -- |
Source: Public Records
Mortgage History
| Date | Status | Borrower | Loan Amount |
|---|---|---|---|
| Open | Browne Corretta N | $417,302 | |
| Closed | Browne Corretta N | $417,302 | |
| Previous Owner | M I M Properties Inc | $217,000 |
Source: Public Records
Tax History Compared to Growth
Tax History
| Year | Tax Paid | Tax Assessment Tax Assessment Total Assessment is a certain percentage of the fair market value that is determined by local assessors to be the total taxable value of land and additions on the property. | Land | Improvement |
|---|---|---|---|---|
| 2025 | $6,492 | $375 | $126 | $249 |
| 2024 | $998 | $371 | $125 | $246 |
| 2023 | $6,402 | $384 | $129 | $255 |
| 2022 | $6,402 | $384 | $129 | $255 |
| 2021 | $9,622 | $384 | $129 | $255 |
| 2020 | $7,879 | $764 | $426 | $338 |
| 2019 | $1,482 | $764 | $426 | $338 |
| 2018 | $6,360 | $764 | $0 | $0 |
| 2017 | $6,071 | $764 | $426 | $338 |
| 2016 | $7,408 | $764 | $426 | $338 |
| 2015 | $1,279 | $764 | $426 | $338 |
| 2014 | $1,279 | $764 | $426 | $338 |
| 2013 | $1,184 | $764 | $426 | $338 |
Source: Public Records
Map
Nearby Homes