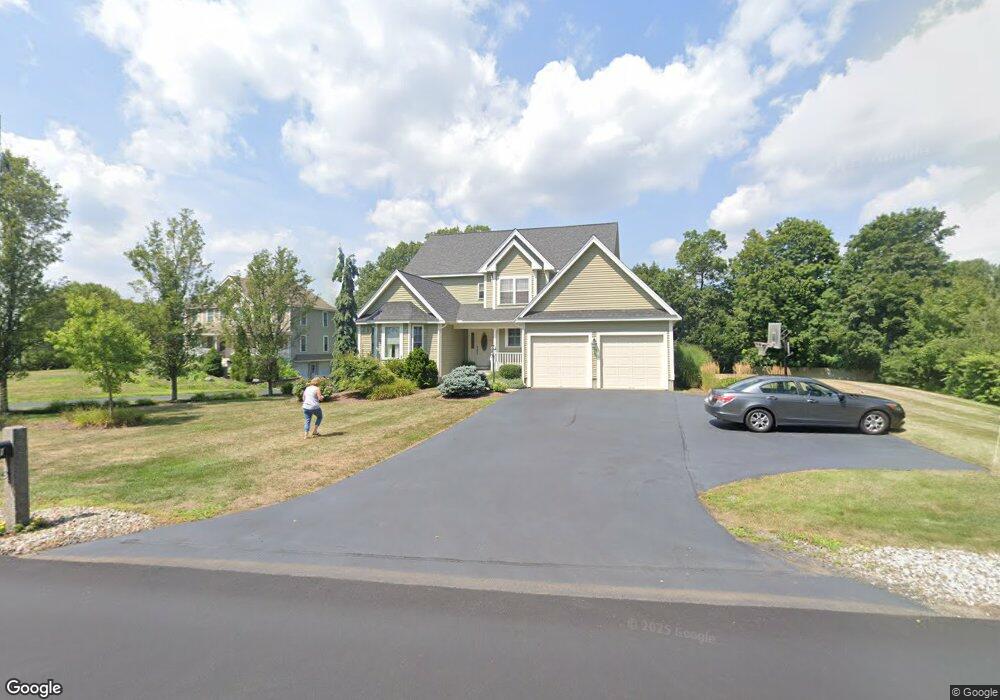
11 Forest St Middleton, MA 01949
Estimated Value: $1,040,000 - $1,298,000
4
Beds
4
Baths
2,495
Sq Ft
$468/Sq Ft
Est. Value
About This Home
This home is located at 11 Forest St, Middleton, MA 01949 and is currently estimated at $1,166,911, approximately $467 per square foot. 11 Forest St is a home located in Essex County with nearby schools including Howe-Manning Elementary School, Fuller Meadow Elementary School, and Masconomet Regional Middle School.
Ownership History
Date
Name
Owned For
Owner Type
Purchase Details
Closed on
May 25, 2018
Sold by
Kostos Steven G
Bought by
Kostos Ft and Kostos
Current Estimated Value
Purchase Details
Closed on
Apr 2, 2015
Sold by
Kostos Steven G and Kostos Hertrude M
Bought by
Kostos Steven G
Purchase Details
Closed on
Aug 20, 2008
Sold by
Prime Invest Forest Ll
Bought by
Kostos Steven G and Kostos Gertrude M
Create a Home Valuation Report for This Property
The Home Valuation Report is an in-depth analysis detailing your home's value as well as a comparison with similar homes in the area
Home Values in the Area
Average Home Value in this Area
Purchase History
| Date | Buyer | Sale Price | Title Company |
|---|---|---|---|
| Kostos Ft | -- | -- | |
| Kostos Ft | -- | -- | |
| Kostos Steven G | -- | -- | |
| Kostos Steven G | -- | -- | |
| Kostos Steven G | $613,100 | -- | |
| Kostos Steven G | $613,100 | -- |
Source: Public Records
Mortgage History
| Date | Status | Borrower | Loan Amount |
|---|---|---|---|
| Previous Owner | Kostos Steven G | $309,000 | |
| Previous Owner | Kostos Steven G | $270,000 | |
| Previous Owner | Kostos Steven G | $270,000 | |
| Previous Owner | Kostos Steven G | $270,000 |
Source: Public Records
Tax History
| Year | Tax Paid | Tax Assessment Tax Assessment Total Assessment is a certain percentage of the fair market value that is determined by local assessors to be the total taxable value of land and additions on the property. | Land | Improvement |
|---|---|---|---|---|
| 2025 | $13,575 | $1,141,700 | $373,800 | $767,900 |
| 2024 | $12,932 | $1,096,900 | $347,400 | $749,500 |
| 2023 | $11,569 | $898,900 | $347,400 | $551,500 |
| 2022 | $10,473 | $790,400 | $280,700 | $509,700 |
| 2021 | $10,129 | $738,300 | $248,700 | $489,600 |
| 2020 | $10,133 | $744,000 | $248,700 | $495,300 |
| 2019 | $10,020 | $731,900 | $248,700 | $483,200 |
| 2018 | $9,551 | $684,200 | $223,700 | $460,500 |
| 2017 | $9,151 | $656,000 | $202,300 | $453,700 |
| 2016 | $9,290 | $668,800 | $221,500 | $447,300 |
| 2015 | $8,662 | $628,600 | $187,900 | $440,700 |
Source: Public Records
Map
Nearby Homes
- 11 James Coffin Way Unit 11
- 69 Forest St
- 78 Essex St
- 15 Rowell Ln Unit 15
- 47 Maple St Unit A
- 37 White Cedar Dr Unit 37
- 7 James Ave
- 10 Oak St
- 2 Tyler Ln
- 6 White Ln
- 6 Cabral Dr
- 1 Mills Point Unit 1
- 14 Niblick Way
- 7 Wedge Ct Unit 7
- 2 Wedge Ct Unit 2
- 17 Lavoie Ln
- 220 Swan Pond Rd
- 34 Spoon Way
- 3 Warren Dr
- 12 Couture Way
Your Personal Tour Guide
Ask me questions while you tour the home.