11 Gile Dr Unit 2B Hanover, NH 03755
Estimated Value: $490,125 - $632,000
2
Beds
2
Baths
1,230
Sq Ft
$448/Sq Ft
Est. Value
About This Home
This home is located at 11 Gile Dr Unit 2B, Hanover, NH 03755 and is currently estimated at $551,531, approximately $448 per square foot. 11 Gile Dr Unit 2B is a home located in Grafton County with nearby schools including Bernice A. Ray School, Frances C. Richmond School, and Hanover High School.
Ownership History
Date
Name
Owned For
Owner Type
Purchase Details
Closed on
Sep 27, 2023
Sold by
Estes Timothy R
Bought by
Timothy R Estes T R and Timothy Estes
Current Estimated Value
Purchase Details
Closed on
Oct 31, 2019
Sold by
Ocallaghan Jeanne and Taylor Stephen
Bought by
Estes Timothy R
Home Financials for this Owner
Home Financials are based on the most recent Mortgage that was taken out on this home.
Original Mortgage
$282,750
Interest Rate
3.7%
Mortgage Type
Purchase Money Mortgage
Purchase Details
Closed on
Aug 29, 2011
Sold by
Gile Cmnty Hsng Re Llc
Bought by
Ocallaghan Jeanne and Taylor Stephen
Home Financials for this Owner
Home Financials are based on the most recent Mortgage that was taken out on this home.
Original Mortgage
$196,000
Interest Rate
4.53%
Mortgage Type
Purchase Money Mortgage
Create a Home Valuation Report for This Property
The Home Valuation Report is an in-depth analysis detailing your home's value as well as a comparison with similar homes in the area
Home Values in the Area
Average Home Value in this Area
Purchase History
| Date | Buyer | Sale Price | Title Company |
|---|---|---|---|
| Timothy R Estes T R | -- | None Available | |
| Estes Timothy R | $353,466 | -- | |
| Ocallaghan Jeanne | $245,000 | -- |
Source: Public Records
Mortgage History
| Date | Status | Borrower | Loan Amount |
|---|---|---|---|
| Previous Owner | Estes Timothy R | $282,750 | |
| Previous Owner | Ocallaghan Jeanne | $196,000 |
Source: Public Records
Tax History Compared to Growth
Tax History
| Year | Tax Paid | Tax Assessment Tax Assessment Total Assessment is a certain percentage of the fair market value that is determined by local assessors to be the total taxable value of land and additions on the property. | Land | Improvement |
|---|---|---|---|---|
| 2024 | $6,827 | $354,300 | $0 | $354,300 |
| 2023 | $6,569 | $354,300 | $0 | $354,300 |
| 2022 | $6,303 | $354,300 | $0 | $354,300 |
| 2021 | $6,250 | $354,300 | $0 | $354,300 |
| 2020 | $5,768 | $285,400 | $0 | $285,400 |
| 2019 | $5,688 | $285,400 | $0 | $285,400 |
| 2018 | $5,488 | $285,400 | $0 | $285,400 |
| 2017 | $5,101 | $235,200 | $80,100 | $155,100 |
| 2016 | $5,007 | $235,200 | $80,100 | $155,100 |
| 2015 | $4,911 | $235,200 | $80,100 | $155,100 |
| 2014 | $4,711 | $235,200 | $80,100 | $155,100 |
| 2013 | $4,542 | $235,200 | $80,100 | $155,100 |
| 2012 | $4,619 | $249,800 | $76,100 | $173,700 |
Source: Public Records
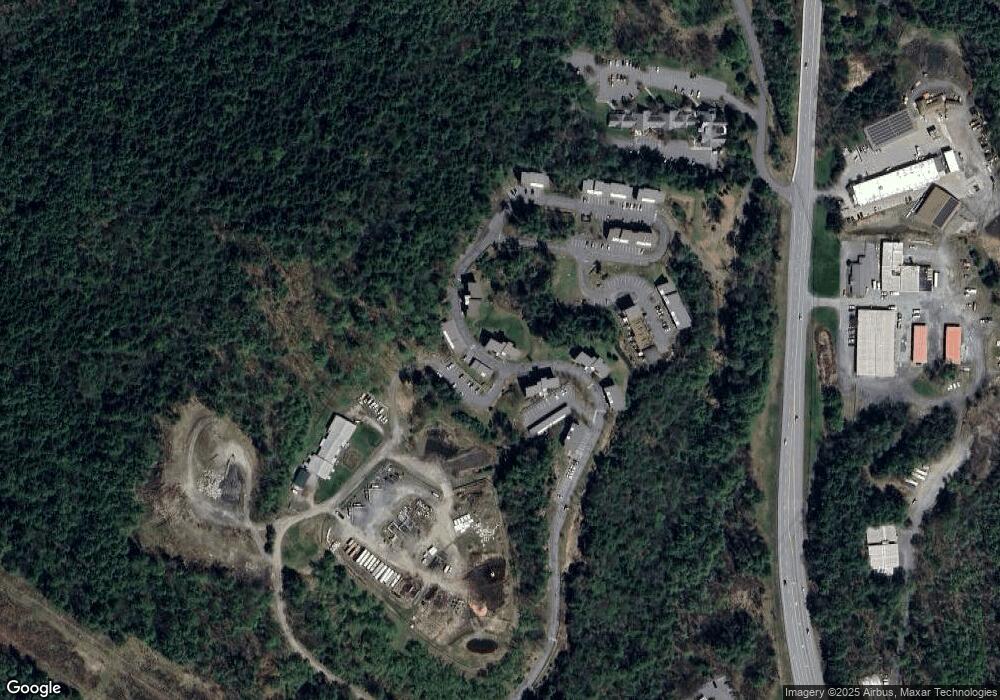
Map
Nearby Homes
- 85 Lebanon St
- 5 College Hill
- 37 Low Rd
- 33 E Wheelock St
- 5 E Wilder Rd
- 131 Brook Hollow
- 126 Brook Hollow
- 0 Mount Support Rd
- 153 Greensboro Rd
- 9 Walnut St
- 13 Hawthorn St
- 1668 Hartford Ave
- 99 Depot St
- 61 Depot St
- 78 Division St
- 1 Depot St
- 147 Etna Rd
- 55 Horseshoe Ave
- 2577 Hartford Ave
- 120 Wolf Rd Unit 53
- 11 Gile Dr Unit 1B
- 11 Gile Dr Unit TA
- 11 Gile Dr Unit 1A
- 11 Gile Dr Unit TB
- 11 Gile Dr Unit 2A
- 15 Gile Dr
- 15 Gile Dr Unit 1B
- 15 Gile Dr Unit 2B
- 15 Gile Dr Unit TB
- 15 Gile Dr Unit 3B
- 15 Gile Dr Unit 3A
- 15 Gile Dr Unit 2A
- 15 Gile Dr Unit 1A
- 15 Gile Dr Unit 3 A
- 15 Gile Dr Unit 1A
- 15 Gile Dr Unit . 3A
- 7 Gile Dr Unit 2A
- 7 Gile Dr Unit 1A
- 7 Gile Dr Unit 3A
- 8 Gile Dr Unit 3B