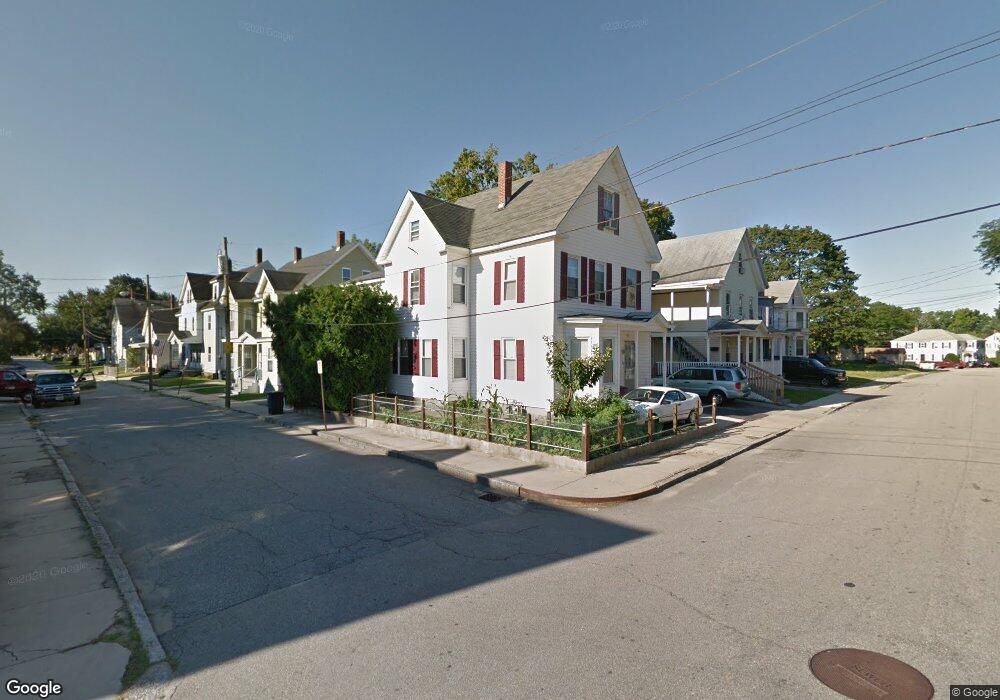
11 Gillis St Nashua, NH 03060
Downtown Nashua NeighborhoodEstimated Value: $456,000 - $501,000
4
Beds
2
Baths
2,073
Sq Ft
$232/Sq Ft
Est. Value
About This Home
This home is located at 11 Gillis St, Nashua, NH 03060 and is currently estimated at $480,163, approximately $231 per square foot. 11 Gillis St is a home located in Hillsborough County with nearby schools including Dr. Norman W. Crisp Elementary School, Elm Street Middle School, and Nashua High School North.
Ownership History
Date
Name
Owned For
Owner Type
Purchase Details
Closed on
Mar 22, 2017
Sold by
Martinez Felipe and Martinez Mercedes
Bought by
Martinez Felipe and Martinez Mercedes
Current Estimated Value
Home Financials for this Owner
Home Financials are based on the most recent Mortgage that was taken out on this home.
Original Mortgage
$161,000
Outstanding Balance
$132,868
Interest Rate
4.17%
Mortgage Type
New Conventional
Estimated Equity
$347,295
Create a Home Valuation Report for This Property
The Home Valuation Report is an in-depth analysis detailing your home's value as well as a comparison with similar homes in the area
Home Values in the Area
Average Home Value in this Area
Purchase History
| Date | Buyer | Sale Price | Title Company |
|---|---|---|---|
| Martinez Felipe | -- | -- |
Source: Public Records
Mortgage History
| Date | Status | Borrower | Loan Amount |
|---|---|---|---|
| Open | Martinez Felipe | $161,000 |
Source: Public Records
Tax History Compared to Growth
Tax History
| Year | Tax Paid | Tax Assessment Tax Assessment Total Assessment is a certain percentage of the fair market value that is determined by local assessors to be the total taxable value of land and additions on the property. | Land | Improvement |
|---|---|---|---|---|
| 2024 | $6,557 | $412,400 | $118,500 | $293,900 |
| 2023 | $6,366 | $349,200 | $94,800 | $254,400 |
| 2022 | $6,310 | $349,200 | $94,800 | $254,400 |
| 2021 | $5,162 | $222,300 | $63,200 | $159,100 |
| 2020 | $5,026 | $222,300 | $63,200 | $159,100 |
| 2019 | $4,837 | $222,300 | $63,200 | $159,100 |
| 2018 | $4,715 | $222,300 | $63,200 | $159,100 |
| 2017 | $5,034 | $195,200 | $59,500 | $135,700 |
| 2016 | $4,894 | $195,200 | $59,500 | $135,700 |
| 2015 | $4,788 | $195,200 | $59,500 | $135,700 |
| 2014 | $4,695 | $195,200 | $59,500 | $135,700 |
Source: Public Records
Map
Nearby Homes
- 13 Mulvanity St
- 65 Allds St
- 18 Harbor Ave Unit 208
- 4 Chase St
- 2 Lyons St
- 76 Gillis St
- 24 E Otterson St
- 5 Mulberry St
- 13 Sapphire Ln
- 1 Circle Ave
- 8 Buck St Unit 10
- 15 Atherton Ave
- 46 Perham St Unit 214
- 19 Atherton Ave
- 21 Library St
- 15 Lovell St Unit 3
- 15 Lovell St Unit 7
- 15 Lovell St Unit 10
- 37 Library St
- 39 Library St