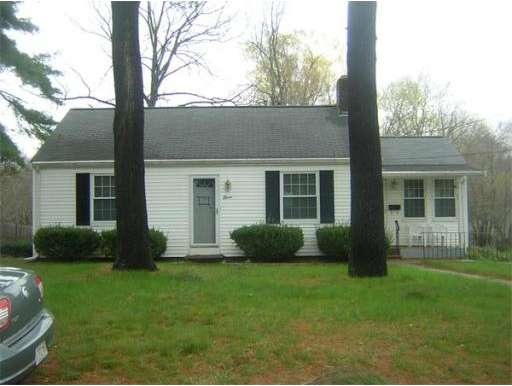
11 Glen St Bellingham, MA 02019
About This Home
As of December 2015** CASH OFFERS ONLY. ** Bank owned property. reverse mortgage governed by HUD guildlines(see attachment). title V is the buyers responsibility. ** There is a right of way on right hand side subject driveway. Every buyer must perform their own due diligence. **

Ownership History
Purchase Details
Home Financials for this Owner
Home Financials are based on the most recent Mortgage that was taken out on this home.Purchase Details
Map
Home Details
Home Type
Single Family
Est. Annual Taxes
$5,081
Year Built
1947
Lot Details
0
Listing Details
- Lot Description: Gentle Slope
- Special Features: 20
- Property Sub Type: Detached
- Year Built: 1947
Interior Features
- Has Basement: Yes
- Fireplaces: 1
- Number of Rooms: 5
- Basement: Full, Finished
Exterior Features
- Exterior: Vinyl
- Foundation: Poured Concrete
Garage/Parking
- Garage Parking: Under
- Garage Spaces: 1
- Parking: Off-Street
- Parking Spaces: 3
Condo/Co-op/Association
- HOA: No
Home Values in the Area
Average Home Value in this Area
Purchase History
| Date | Type | Sale Price | Title Company |
|---|---|---|---|
| Deed | -- | -- | |
| Foreclosure Deed | $208,000 | -- |
Mortgage History
| Date | Status | Loan Amount | Loan Type |
|---|---|---|---|
| Open | $30,000 | Credit Line Revolving | |
| Open | $183,200 | Stand Alone Refi Refinance Of Original Loan | |
| Closed | $25,000 | Closed End Mortgage | |
| Closed | $194,900 | New Conventional | |
| Previous Owner | $337,500 | Reverse Mortgage Home Equity Conversion Mortgage | |
| Previous Owner | $70,000 | No Value Available | |
| Previous Owner | $50,000 | No Value Available | |
| Previous Owner | $10,000 | No Value Available |
Property History
| Date | Event | Price | Change | Sq Ft Price |
|---|---|---|---|---|
| 12/11/2015 12/11/15 | Sold | $259,900 | 0.0% | $207 / Sq Ft |
| 11/11/2015 11/11/15 | Pending | -- | -- | -- |
| 10/22/2015 10/22/15 | For Sale | $259,900 | +136.3% | $207 / Sq Ft |
| 04/24/2015 04/24/15 | Sold | $110,000 | 0.0% | $118 / Sq Ft |
| 02/04/2015 02/04/15 | Pending | -- | -- | -- |
| 01/22/2015 01/22/15 | Off Market | $110,000 | -- | -- |
| 01/12/2015 01/12/15 | For Sale | $110,000 | 0.0% | $118 / Sq Ft |
| 11/03/2014 11/03/14 | Price Changed | $110,000 | 0.0% | $118 / Sq Ft |
| 11/03/2014 11/03/14 | Pending | -- | -- | -- |
| 10/24/2014 10/24/14 | Off Market | $110,000 | -- | -- |
| 08/29/2014 08/29/14 | Pending | -- | -- | -- |
| 08/21/2014 08/21/14 | Off Market | $110,000 | -- | -- |
| 08/19/2014 08/19/14 | Price Changed | $123,500 | -5.0% | $132 / Sq Ft |
| 08/15/2014 08/15/14 | For Sale | $130,000 | +18.2% | $139 / Sq Ft |
| 07/23/2014 07/23/14 | Off Market | $110,000 | -- | -- |
| 06/27/2014 06/27/14 | Price Changed | $130,000 | -7.1% | $139 / Sq Ft |
| 06/19/2014 06/19/14 | For Sale | $139,900 | +27.2% | $149 / Sq Ft |
| 06/07/2014 06/07/14 | Off Market | $110,000 | -- | -- |
| 05/26/2014 05/26/14 | For Sale | $139,900 | -- | $149 / Sq Ft |
Tax History
| Year | Tax Paid | Tax Assessment Tax Assessment Total Assessment is a certain percentage of the fair market value that is determined by local assessors to be the total taxable value of land and additions on the property. | Land | Improvement |
|---|---|---|---|---|
| 2025 | $5,081 | $404,500 | $125,700 | $278,800 |
| 2024 | $4,832 | $375,700 | $114,800 | $260,900 |
| 2023 | $4,655 | $356,700 | $109,300 | $247,400 |
| 2022 | $4,561 | $323,900 | $91,200 | $232,700 |
| 2021 | $4,385 | $304,300 | $91,200 | $213,100 |
| 2020 | $4,002 | $281,400 | $91,200 | $190,200 |
| 2019 | $3,913 | $275,400 | $91,200 | $184,200 |
| 2018 | $3,517 | $244,100 | $88,600 | $155,500 |
| 2017 | $3,417 | $238,300 | $88,600 | $149,700 |
| 2016 | $3,178 | $222,400 | $91,000 | $131,400 |
| 2015 | $2,712 | $190,300 | $88,200 | $102,100 |
| 2014 | $2,895 | $197,500 | $92,900 | $104,600 |
Source: MLS Property Information Network (MLS PIN)
MLS Number: 71687457
APN: BELL-000090-000169
Disclaimer: Certain information contained herein is derived from information provided by parties other than Homes.com. All information provided is deemed reliable, but is not guaranteed to be accurate and should be independently verified.
![]() The property listing data and information, or the Images, set forth herein were provided to MLS Property Information Network, Inc. from third party sources, including sellers, lessors and public records, and were compiled by MLS Property Information Network, Inc. The property listing data and information, and the Images, are for the personal, non-commercial use of consumers having a good faith interest in purchasing or leasing listed properties of the type displayed to them and may not be used for any purpose other than to identify prospective properties which such consumers may have a good faith interest in purchasing or leasing. MLS Property Information Network, Inc. and its subscribers disclaim any and all representations and warranties as to the accuracy of the property listing data and information, or as to the accuracy of any of the Images, set forth herein.
The property listing data and information, or the Images, set forth herein were provided to MLS Property Information Network, Inc. from third party sources, including sellers, lessors and public records, and were compiled by MLS Property Information Network, Inc. The property listing data and information, and the Images, are for the personal, non-commercial use of consumers having a good faith interest in purchasing or leasing listed properties of the type displayed to them and may not be used for any purpose other than to identify prospective properties which such consumers may have a good faith interest in purchasing or leasing. MLS Property Information Network, Inc. and its subscribers disclaim any and all representations and warranties as to the accuracy of the property listing data and information, or as to the accuracy of any of the Images, set forth herein.
- 1 Taft Dr
- 101 Pine Grove Ave
- 8 Bliss Rd
- 3 Dorena St
- 702 Rathbun St
- 0 Central Blvd
- 452 S Main St
- 21 Trenton St
- 194 Paine St
- Lot 2 Pulaski Blvd
- 150 Garden St
- 4 Diana St
- 79 Dewey St
- 111 Harris Pond Rd
- 26 Lakeview St
- 127 St Agnes Ave
- 116 Theresa Marie Ave
- 251 Mendon Rd
- 40 Valley St
- 20 Fox Run Rd Unit 20