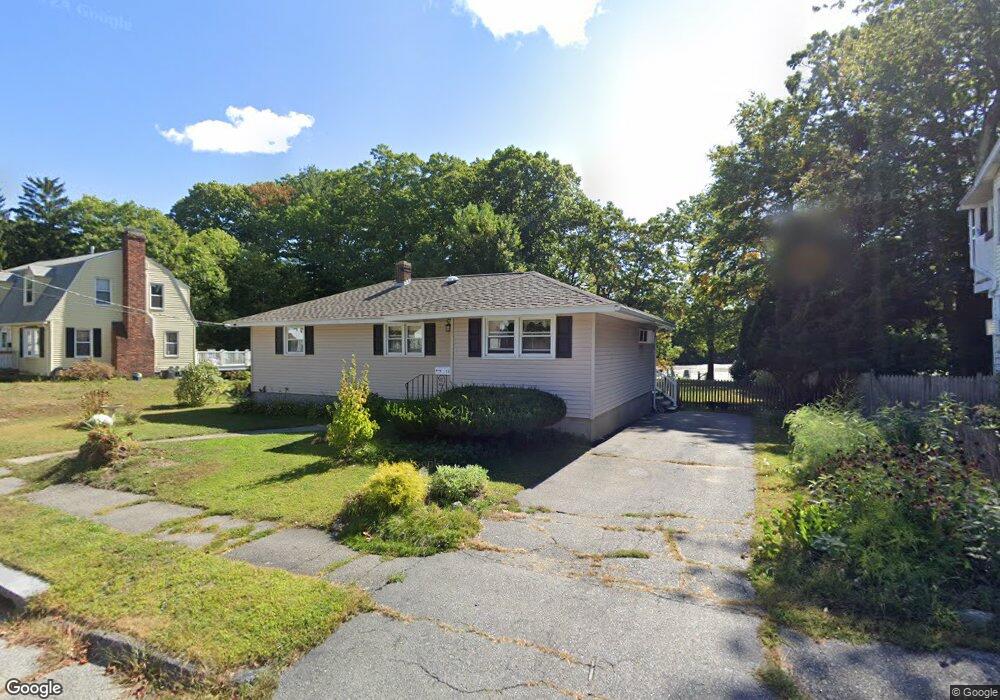
11 Greybert Ln Worcester, MA 01602
Tatnuck NeighborhoodEstimated Value: $389,000 - $439,000
3
Beds
2
Baths
1,054
Sq Ft
$387/Sq Ft
Est. Value
About This Home
This home is located at 11 Greybert Ln, Worcester, MA 01602 and is currently estimated at $407,973, approximately $387 per square foot. 11 Greybert Ln is a home located in Worcester County with nearby schools including Tatnuck Magnet School, Chandler Magnet, and Jacob Hiatt Magnet School.
Ownership History
Date
Name
Owned For
Owner Type
Purchase Details
Closed on
May 29, 1992
Sold by
Goodchild John and Goodchhild Therese
Bought by
Church Michael S and Donna Church
Current Estimated Value
Home Financials for this Owner
Home Financials are based on the most recent Mortgage that was taken out on this home.
Original Mortgage
$83,800
Interest Rate
8.7%
Mortgage Type
Purchase Money Mortgage
Create a Home Valuation Report for This Property
The Home Valuation Report is an in-depth analysis detailing your home's value as well as a comparison with similar homes in the area
Home Values in the Area
Average Home Value in this Area
Purchase History
| Date | Buyer | Sale Price | Title Company |
|---|---|---|---|
| Church Michael S | $104,750 | -- |
Source: Public Records
Mortgage History
| Date | Status | Borrower | Loan Amount |
|---|---|---|---|
| Open | Church Michael S | $73,000 | |
| Closed | Church Michael S | $83,800 |
Source: Public Records
Tax History
| Year | Tax Paid | Tax Assessment Tax Assessment Total Assessment is a certain percentage of the fair market value that is determined by local assessors to be the total taxable value of land and additions on the property. | Land | Improvement |
|---|---|---|---|---|
| 2025 | $4,923 | $373,274 | $148,774 | $224,500 |
| 2024 | $4,860 | $353,474 | $148,774 | $204,700 |
| 2023 | $4,744 | $330,856 | $129,356 | $201,500 |
| 2022 | $4,758 | $312,844 | $140,744 | $172,100 |
| 2021 | $4,480 | $275,212 | $112,712 | $162,500 |
| 2020 | $4,379 | $257,600 | $112,600 | $145,000 |
| 2019 | $4,135 | $229,700 | $101,500 | $128,200 |
| 2018 | $4,086 | $216,100 | $101,500 | $114,600 |
| 2017 | $4,117 | $214,200 | $101,500 | $112,700 |
| 2016 | $3,866 | $187,600 | $75,700 | $111,900 |
| 2015 | $3,765 | $187,600 | $75,700 | $111,900 |
| 2014 | $3,666 | $187,600 | $75,700 | $111,900 |
Source: Public Records
Map
Nearby Homes
- 47R Yarnie Unit 1B
- 47R Yarnie Unit 4A
- 47R Yarnie Unit 1A
- 23 Tiverton Pkwy
- 15 Chesterfield Rd
- 443 Mill St
- 73 Moore Ave
- 10 Wrentham Rd Unit 308
- 53 Tiverton Pkwy
- 38 Glendale St
- 122 Copperfield Rd
- 415 Mill St
- 118 Beaconsfield Rd
- 9 Newburn Rd
- 16 Sherwood Rd
- 44 Drexel St
- 10 Perrot St
- 860 Pleasant St
- 5 Swan Ave Unit B
- 21 Baxter St
Your Personal Tour Guide
Ask me questions while you tour the home.