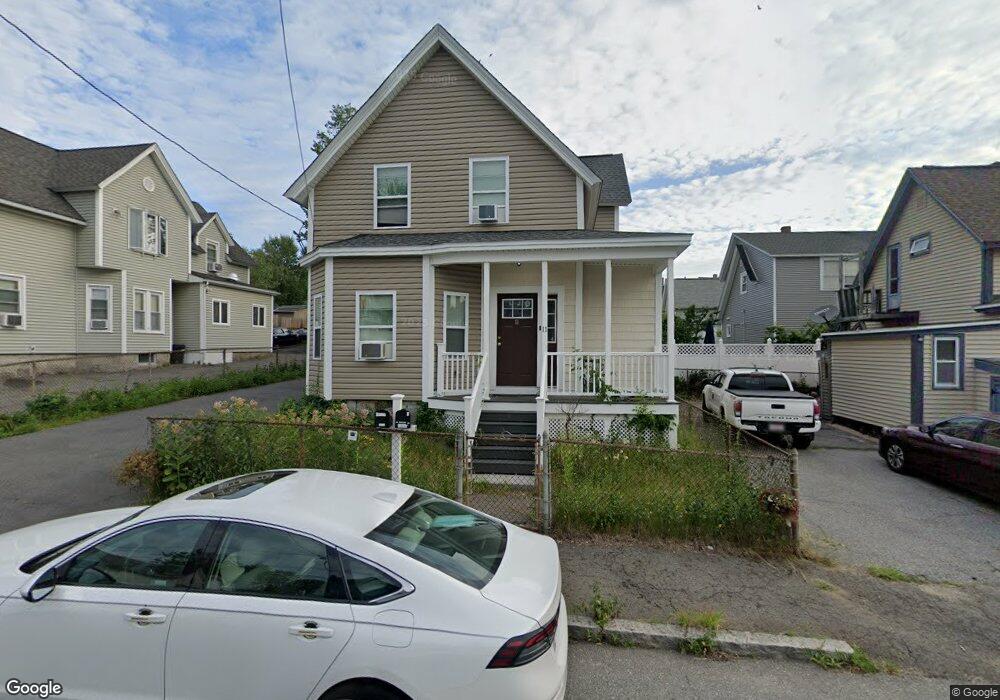
11 Harding St Lowell, MA 01851
Lower Highlands NeighborhoodEstimated Value: $573,000 - $598,000
7
Beds
2
Baths
1,986
Sq Ft
$295/Sq Ft
Est. Value
About This Home
This home is located at 11 Harding St, Lowell, MA 01851 and is currently estimated at $586,000, approximately $295 per square foot. 11 Harding St is a home located in Middlesex County with nearby schools including Charles W. Morey Elementary School, Abraham Lincoln Elementary School, and Dr. Gertrude Bailey Elementary School.
Ownership History
Date
Name
Owned For
Owner Type
Purchase Details
Closed on
Jun 12, 2019
Sold by
Chasse Daniel F
Bought by
Naysean & Teek Llc
Current Estimated Value
Purchase Details
Closed on
May 16, 2019
Sold by
Halsall Dolores A Est and Halsall
Bought by
Chasse Daniel F
Create a Home Valuation Report for This Property
The Home Valuation Report is an in-depth analysis detailing your home's value as well as a comparison with similar homes in the area
Home Values in the Area
Average Home Value in this Area
Purchase History
| Date | Buyer | Sale Price | Title Company |
|---|---|---|---|
| Naysean & Teek Llc | $185,000 | -- | |
| Chasse Daniel F | $85,000 | -- | |
| Chasse Daniel F | $85,000 | -- |
Source: Public Records
Tax History Compared to Growth
Tax History
| Year | Tax Paid | Tax Assessment Tax Assessment Total Assessment is a certain percentage of the fair market value that is determined by local assessors to be the total taxable value of land and additions on the property. | Land | Improvement |
|---|---|---|---|---|
| 2025 | $5,786 | $504,000 | $147,100 | $356,900 |
| 2024 | $5,343 | $448,600 | $132,300 | $316,300 |
| 2023 | $4,961 | $399,400 | $115,100 | $284,300 |
| 2022 | $4,591 | $361,800 | $104,600 | $257,200 |
| 2021 | $4,256 | $316,200 | $91,000 | $225,200 |
| 2020 | $3,546 | $265,400 | $79,500 | $185,900 |
| 2019 | $3,399 | $242,100 | $73,600 | $168,500 |
| 2018 | $3,136 | $217,900 | $67,000 | $150,900 |
| 2017 | $2,965 | $198,700 | $60,900 | $137,800 |
| 2016 | $2,968 | $195,800 | $58,000 | $137,800 |
| 2015 | $2,782 | $179,700 | $59,300 | $120,400 |
| 2013 | $2,601 | $173,300 | $71,000 | $102,300 |
Source: Public Records
Map
Nearby Homes