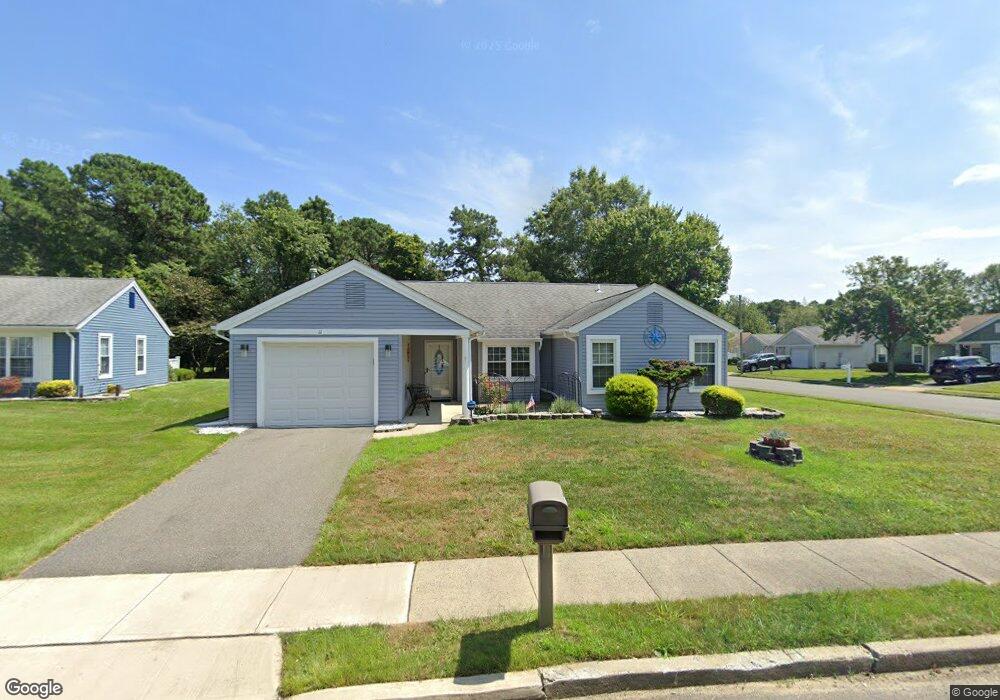
11 Hastings Ct Forked River, NJ 08731
Lacey Township NeighborhoodEstimated Value: $386,000 - $404,000
2
Beds
2
Baths
1,405
Sq Ft
$281/Sq Ft
Est. Value
About This Home
This home is located at 11 Hastings Ct, Forked River, NJ 08731 and is currently estimated at $394,128, approximately $280 per square foot. 11 Hastings Ct is a home located in Ocean County with nearby schools including Lacey Township High School.
Ownership History
Date
Name
Owned For
Owner Type
Purchase Details
Closed on
Sep 19, 2017
Sold by
Corcione Carmen V and Corcione Kathleen
Bought by
Kimmel Dorothy M
Current Estimated Value
Purchase Details
Closed on
Dec 15, 2010
Sold by
Ratz Ronald L
Bought by
Corcione Carmen
Purchase Details
Closed on
Dec 5, 2007
Sold by
Greb Wilbur P
Bought by
Ratz Ronald L
Home Financials for this Owner
Home Financials are based on the most recent Mortgage that was taken out on this home.
Original Mortgage
$100,000
Interest Rate
6.3%
Mortgage Type
Stand Alone First
Purchase Details
Closed on
Dec 16, 2002
Sold by
K Land No Ii Llc
Bought by
Callis David H and Callis Deborah
Home Financials for this Owner
Home Financials are based on the most recent Mortgage that was taken out on this home.
Original Mortgage
$312,900
Interest Rate
5.99%
Create a Home Valuation Report for This Property
The Home Valuation Report is an in-depth analysis detailing your home's value as well as a comparison with similar homes in the area
Home Values in the Area
Average Home Value in this Area
Purchase History
| Date | Buyer | Sale Price | Title Company |
|---|---|---|---|
| Kimmel Dorothy M | $191,000 | Old Republic National Title | |
| Corcione Carmen | $157,500 | Multiple | |
| Ratz Ronald L | $195,000 | Multiple | |
| Callis David H | $391,160 | -- |
Source: Public Records
Mortgage History
| Date | Status | Borrower | Loan Amount |
|---|---|---|---|
| Previous Owner | Ratz Ronald L | $100,000 | |
| Previous Owner | Callis David H | $312,900 |
Source: Public Records
Tax History Compared to Growth
Tax History
| Year | Tax Paid | Tax Assessment Tax Assessment Total Assessment is a certain percentage of the fair market value that is determined by local assessors to be the total taxable value of land and additions on the property. | Land | Improvement |
|---|---|---|---|---|
| 2025 | $3,925 | $154,900 | $48,000 | $106,900 |
| 2024 | $3,670 | $154,900 | $48,000 | $106,900 |
| 2023 | $3,505 | $154,900 | $48,000 | $106,900 |
| 2022 | $3,505 | $154,900 | $48,000 | $106,900 |
| 2021 | $3,447 | $154,900 | $48,000 | $106,900 |
| 2020 | $3,337 | $154,900 | $48,000 | $106,900 |
| 2019 | $3,278 | $154,900 | $48,000 | $106,900 |
| 2018 | $3,239 | $154,900 | $48,000 | $106,900 |
| 2017 | $3,165 | $154,900 | $48,000 | $106,900 |
| 2016 | $3,152 | $154,900 | $48,000 | $106,900 |
| 2015 | $3,011 | $154,900 | $48,000 | $106,900 |
| 2014 | $2,783 | $161,800 | $58,000 | $103,800 |
Source: Public Records
Map
Nearby Homes
- 5 Portsmouth Dr
- 2095 Llewellyn Pkwy
- 42 Canterbury Dr
- 20 Norwick Dr
- 2028 Brookdale Dr
- 1503 Clearview St
- 1485 Earie Way
- 2144 Hollywood Dr
- 1445 Argonne Ave
- 1461 Earie Way
- 0000 Earie Way
- 1436 Leguene Ave
- 1800 Ravine Dr
- 1515 Clair Rd
- 1427 Foch Ave
- 1409 Kay St
- 1316 Wood Ave
- 483 Lake Barnegat Dr S
- 476 Lake Barnegat Dr S