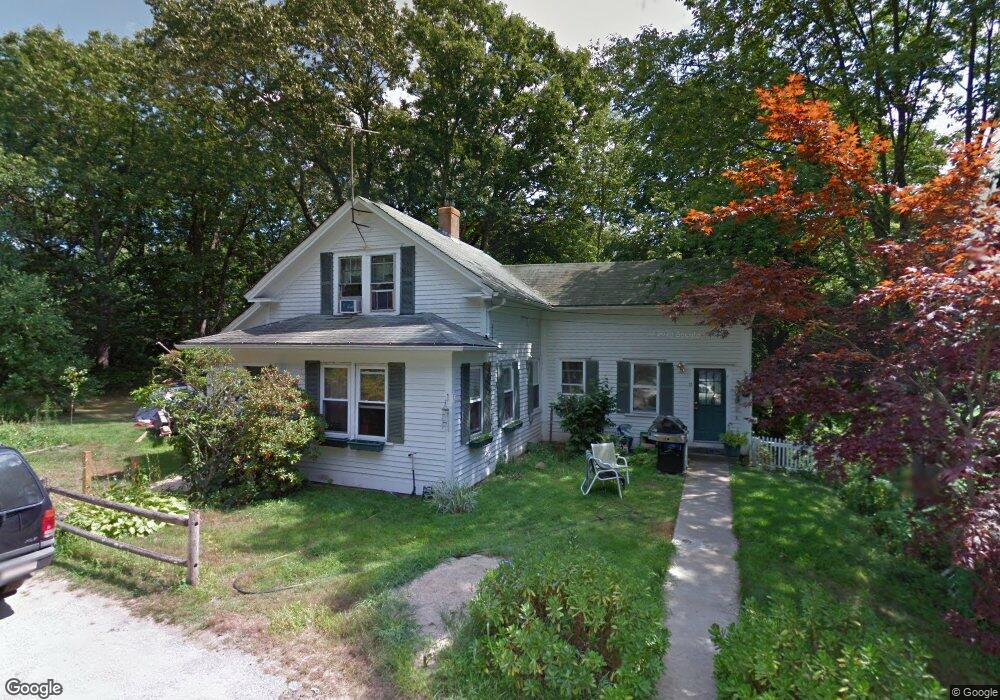
11 Havens Ct West Warwick, RI 02893
Lippitt-Harris NeighborhoodEstimated Value: $323,000 - $389,000
2
Beds
1
Bath
1,497
Sq Ft
$238/Sq Ft
Est. Value
About This Home
This home is located at 11 Havens Ct, West Warwick, RI 02893 and is currently estimated at $356,656, approximately $238 per square foot. 11 Havens Ct is a home located in Kent County with nearby schools including West Warwick High School and St Joseph School.
Ownership History
Date
Name
Owned For
Owner Type
Purchase Details
Closed on
Dec 30, 2024
Sold by
Kidd Joanne L Est and Eastman
Bought by
Richard Janet L and Forcier James L
Current Estimated Value
Purchase Details
Closed on
Jul 24, 2013
Sold by
Forcier Eleanor M Est and Richards
Bought by
Richard Janet L and Forcier James L
Home Financials for this Owner
Home Financials are based on the most recent Mortgage that was taken out on this home.
Original Mortgage
$240,000
Interest Rate
3.97%
Mortgage Type
New Conventional
Create a Home Valuation Report for This Property
The Home Valuation Report is an in-depth analysis detailing your home's value as well as a comparison with similar homes in the area
Home Values in the Area
Average Home Value in this Area
Purchase History
| Date | Buyer | Sale Price | Title Company |
|---|---|---|---|
| Richard Janet L | -- | None Available | |
| Richard Janet L | -- | None Available | |
| Richard Janet L | -- | -- | |
| Richard Janet L | -- | -- |
Source: Public Records
Mortgage History
| Date | Status | Borrower | Loan Amount |
|---|---|---|---|
| Previous Owner | Richard Janet L | $240,000 |
Source: Public Records
Tax History Compared to Growth
Tax History
| Year | Tax Paid | Tax Assessment Tax Assessment Total Assessment is a certain percentage of the fair market value that is determined by local assessors to be the total taxable value of land and additions on the property. | Land | Improvement |
|---|---|---|---|---|
| 2025 | $3,300 | $230,900 | $49,900 | $181,000 |
| 2024 | $3,768 | $201,600 | $47,100 | $154,500 |
| 2023 | $3,693 | $201,600 | $47,100 | $154,500 |
| 2022 | $3,637 | $201,600 | $47,100 | $154,500 |
| 2021 | $3,406 | $148,100 | $47,100 | $101,000 |
| 2020 | $3,406 | $148,100 | $47,100 | $101,000 |
| 2019 | $4,342 | $148,100 | $47,100 | $101,000 |
| 2018 | $5 | $119,300 | $47,100 | $72,200 |
| 2017 | $3,139 | $119,300 | $47,100 | $72,200 |
| 2016 | $3,083 | $119,300 | $47,100 | $72,200 |
| 2015 | $2,845 | $109,600 | $47,100 | $62,500 |
| 2014 | $2,783 | $109,600 | $47,100 | $62,500 |
Source: Public Records
Map
Nearby Homes
- 33 Havens Ct
- 12 Havens Ct
- 10 Havens Ct
- 17 Bradford Ct
- 20 Richard St
- 5 Bradford Ct
- 135 Bradford Ct
- 19 N Pleasant St
- 19 Bradford Ct
- 29 N Pleasant St
- 23 N Pleasant St
- 35 N Pleasant St
- 25 N Pleasant St
- 21 N Pleasant St
- 3 Justa St
- 39 N Pleasant St
- 12 Bradford Ct
- 3 Bradford Ct
- 0 N Pleasant St
- 41 N Pleasant St Unit 1st floor Left side