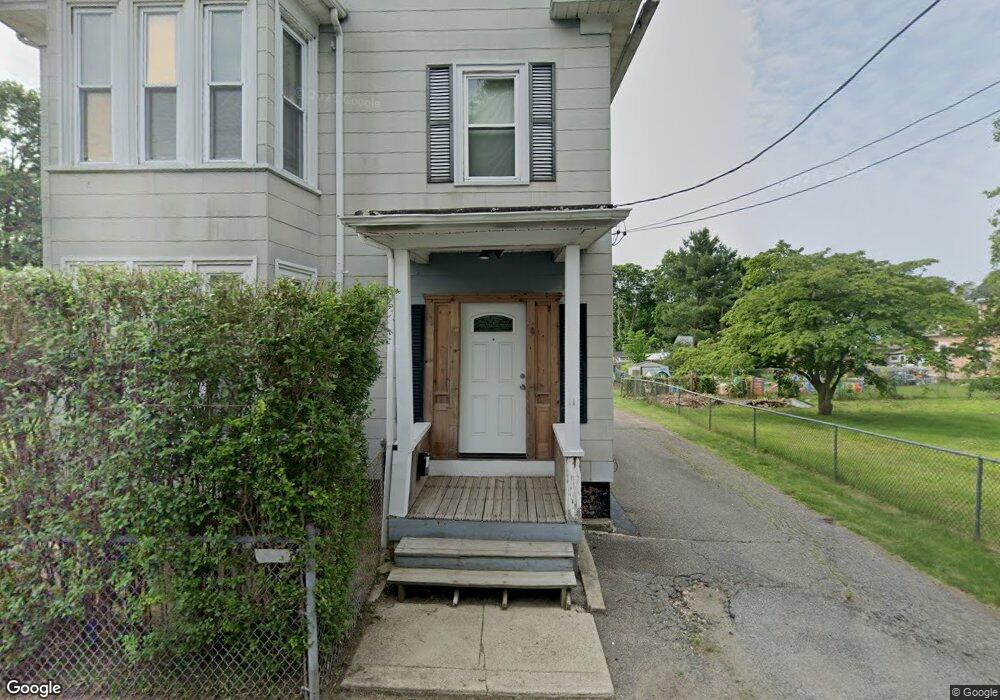
11 Hemlock St Brockton, MA 02302
Clifton Heights NeighborhoodEstimated Value: $652,733 - $813,000
5
Beds
3
Baths
2,807
Sq Ft
$260/Sq Ft
Est. Value
About This Home
This home is located at 11 Hemlock St, Brockton, MA 02302 and is currently estimated at $728,433, approximately $259 per square foot. 11 Hemlock St is a home located in Plymouth County with nearby schools including Gilmore Elementary School, John F. Kennedy Elementary School, and Davis K-8 School.
Ownership History
Date
Name
Owned For
Owner Type
Purchase Details
Closed on
Apr 6, 2011
Sold by
Fhlmc
Bought by
Jardine Erikka R
Current Estimated Value
Home Financials for this Owner
Home Financials are based on the most recent Mortgage that was taken out on this home.
Original Mortgage
$156,559
Outstanding Balance
$107,411
Interest Rate
4.99%
Mortgage Type
Purchase Money Mortgage
Estimated Equity
$621,022
Purchase Details
Closed on
Jan 19, 2010
Sold by
Winston Kyle T
Bought by
Federal National Mortgage Association
Purchase Details
Closed on
Mar 1, 2004
Sold by
William William F and William Margaret B
Bought by
Winston Kyle T
Home Financials for this Owner
Home Financials are based on the most recent Mortgage that was taken out on this home.
Original Mortgage
$330,600
Interest Rate
5.65%
Mortgage Type
Purchase Money Mortgage
Create a Home Valuation Report for This Property
The Home Valuation Report is an in-depth analysis detailing your home's value as well as a comparison with similar homes in the area
Home Values in the Area
Average Home Value in this Area
Purchase History
| Date | Buyer | Sale Price | Title Company |
|---|---|---|---|
| Jardine Erikka R | $145,000 | -- | |
| Federal National Mortgage Association | $342,100 | -- | |
| Winston Kyle T | $348,000 | -- |
Source: Public Records
Mortgage History
| Date | Status | Borrower | Loan Amount |
|---|---|---|---|
| Open | Jardine Erikka R | $156,559 | |
| Previous Owner | Winston Kyle T | $313,600 | |
| Previous Owner | Winston Kyle T | $330,600 |
Source: Public Records
Tax History
| Year | Tax Paid | Tax Assessment Tax Assessment Total Assessment is a certain percentage of the fair market value that is determined by local assessors to be the total taxable value of land and additions on the property. | Land | Improvement |
|---|---|---|---|---|
| 2025 | $7,381 | $609,500 | $140,500 | $469,000 |
| 2024 | $7,331 | $609,900 | $140,500 | $469,400 |
| 2023 | $6,917 | $532,900 | $106,500 | $426,400 |
| 2022 | $6,549 | $468,800 | $96,800 | $372,000 |
| 2021 | $5,406 | $372,800 | $80,900 | $291,900 |
| 2020 | $5,775 | $381,200 | $75,300 | $305,900 |
| 2019 | $5,579 | $359,000 | $73,300 | $285,700 |
| 2018 | $5,165 | $321,600 | $73,300 | $248,300 |
| 2017 | $4,914 | $305,200 | $73,300 | $231,900 |
| 2016 | $4,435 | $255,500 | $71,200 | $184,300 |
| 2015 | $3,334 | $183,700 | $71,200 | $112,500 |
| 2014 | $3,327 | $183,500 | $71,200 | $112,300 |
Source: Public Records
Map
Nearby Homes
- 103 Clinton St
- 28 Clinton St
- 28 Grove Ave
- 112 Laureston St
- 24 E Chestnut St
- 23 E Chestnut St
- 25 Tremont St
- 936 Warren Ave
- 107 N Leyden St
- 223 Clinton St Unit 16
- 809 Warren Ave
- 18 Florence St
- 60 Tremont St
- 65 Tremont St
- 41 Riverview St
- 100 Concord St
- 26 South St
- 15 Market St
- 34 South St
- 4 Virginia Ave
Your Personal Tour Guide
Ask me questions while you tour the home.