
Landlord's Agent in 2021
John Martein
RE/MAX
(603) 305-8422
3 in this area
37 Total Sales
Estimated Value: $690,000 - $752,000
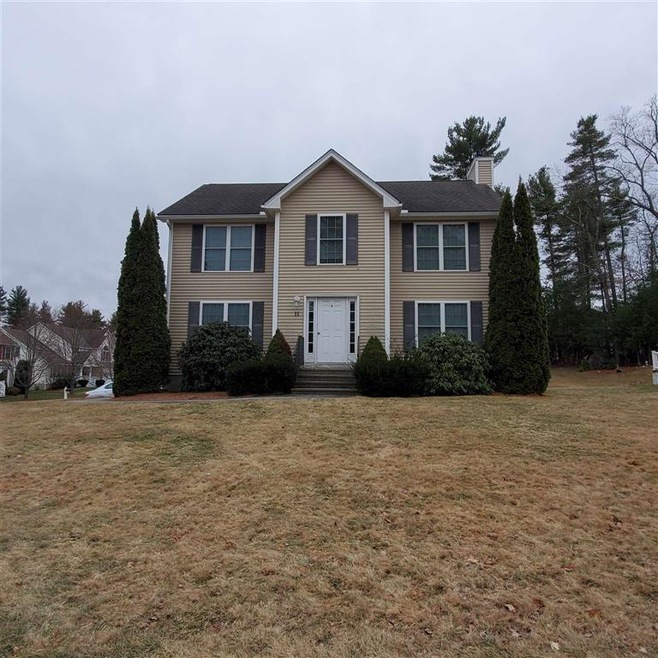
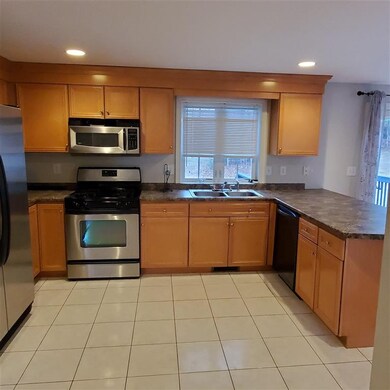
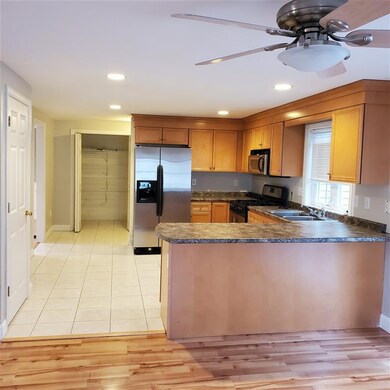
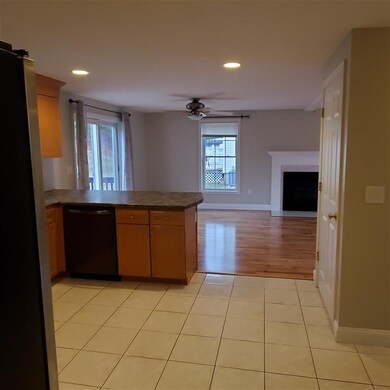
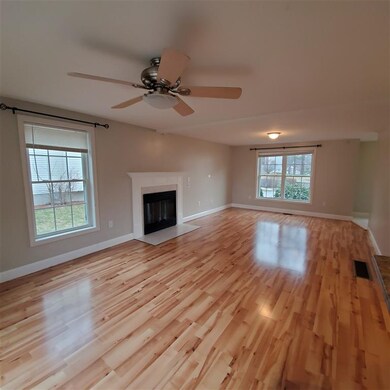
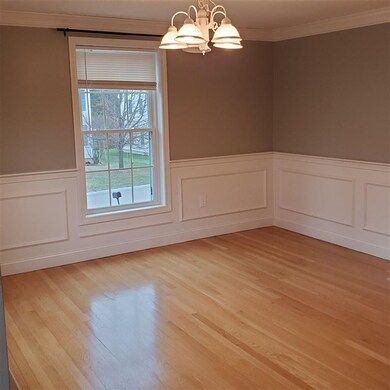
Rental at lovely Maple wood Estates. Open concept 25 x 13 great room with fireplace. Tiled kitchen, foyer, hardwood floors, formal dining room with moldings, chair rails. Walk-in closets in master. NO pets, NO smoking. Credit, job, landlord references. Refrigerator "as is". Natural Gasheat, Central Air, Town Water & Sewer. Available Lease. Available February 1, 2021.
Last Agent to Rent the Property
RE/MAX Innovative Properties License #068829 Listed on: 01/29/2021
| Date | Buyer | Sale Price | Title Company |
|---|---|---|---|
| Dabi Kapil | $380,300 | -- |
| Date | Status | Borrower | Loan Amount |
|---|---|---|---|
| Open | Dabi Kapil | $274,000 | |
| Closed | Dabi Kapil | $100,000 | |
| Closed | Dabi Kapil | $301,250 |
| Date | Event | Price | List to Sale | Price per Sq Ft |
|---|---|---|---|---|
| 02/09/2021 02/09/21 | Rented | $2,850 | 0.0% | -- |
| 02/02/2021 02/02/21 | Under Contract | -- | -- | -- |
| 01/29/2021 01/29/21 | For Rent | $2,850 | +5.6% | -- |
| 08/28/2019 08/28/19 | Rented | $2,700 | 0.0% | -- |
| 08/23/2019 08/23/19 | Price Changed | $2,700 | -3.6% | $1 / Sq Ft |
| 07/29/2019 07/29/19 | For Rent | $2,800 | 0.0% | -- |
| 08/09/2018 08/09/18 | Rented | $2,800 | -2.6% | -- |
| 07/17/2018 07/17/18 | Under Contract | -- | -- | -- |
| 07/12/2018 07/12/18 | For Rent | $2,875 | +15.0% | -- |
| 06/26/2017 06/26/17 | Rented | $2,500 | 0.0% | -- |
| 04/13/2017 04/13/17 | For Rent | $2,500 | +2.0% | -- |
| 08/24/2016 08/24/16 | Rented | $2,450 | 0.0% | -- |
| 08/22/2016 08/22/16 | Under Contract | -- | -- | -- |
| 07/19/2016 07/19/16 | For Rent | $2,450 | 0.0% | -- |
| 06/12/2015 06/12/15 | Rented | $2,450 | 0.0% | -- |
| 04/15/2015 04/15/15 | Under Contract | -- | -- | -- |
| 03/16/2015 03/16/15 | For Rent | $2,450 | +6.8% | -- |
| 06/04/2012 06/04/12 | Rented | $2,295 | 0.0% | -- |
| 05/29/2012 05/29/12 | Under Contract | -- | -- | -- |
| 05/23/2012 05/23/12 | For Rent | $2,295 | -- | -- |
| Year | Tax Paid | Tax Assessment Tax Assessment Total Assessment is a certain percentage of the fair market value that is determined by local assessors to be the total taxable value of land and additions on the property. | Land | Improvement |
|---|---|---|---|---|
| 2024 | $10,545 | $663,200 | $174,200 | $489,000 |
| 2023 | $10,027 | $550,000 | $139,400 | $410,600 |
| 2022 | $9,939 | $550,000 | $139,400 | $410,600 |
| 2021 | $9,163 | $394,600 | $130,100 | $264,500 |
| 2020 | $8,922 | $394,600 | $130,100 | $264,500 |
| 2019 | $8,586 | $394,600 | $130,100 | $264,500 |
| 2018 | $8,369 | $394,600 | $130,100 | $264,500 |
| 2017 | $8,596 | $333,300 | $109,100 | $224,200 |
| 2016 | $8,356 | $333,300 | $109,100 | $224,200 |
| 2015 | $8,176 | $333,300 | $109,100 | $224,200 |
| 2014 | $8,016 | $333,300 | $109,100 | $224,200 |
Landlord's Agent in 2021
John Martein
RE/MAX
(603) 305-8422
3 in this area
37 Total Sales
S
Seller's Agent in 2019
Shirley Ong
RE/MAX
Buyer's Agent in 2016
Viv Willett
RE/MAX
1 in this area
10 Total Sales
Buyer's Agent in 2015
Tim Joyce
Keller Williams Gateway Realty
(603) 765-3761
8 in this area
33 Total Sales
Source: PrimeMLS
MLS Number: 4845580
APN: NASH-000000-000000-002702C
Disclaimer: Certain information contained herein is derived from information provided by parties other than Homes.com. All information provided is deemed reliable, but is not guaranteed to be accurate and should be independently verified.
![]() Copyright 2025 PrimeMLS, Inc. All rights reserved. This information is deemed reliable, but not guaranteed. The data relating to real estate displayed on this display comes in part from the IDX Program of PrimeMLS. The information being provided is for consumers’ personal, non-commercial use and may not be used for any purpose other than to identify prospective properties consumers may be interested in purchasing.
Copyright 2025 PrimeMLS, Inc. All rights reserved. This information is deemed reliable, but not guaranteed. The data relating to real estate displayed on this display comes in part from the IDX Program of PrimeMLS. The information being provided is for consumers’ personal, non-commercial use and may not be used for any purpose other than to identify prospective properties consumers may be interested in purchasing.