11 High St Natick, MA 01760
Estimated Value: $980,000 - $1,121,000
4
Beds
2
Baths
2,451
Sq Ft
$424/Sq Ft
Est. Value
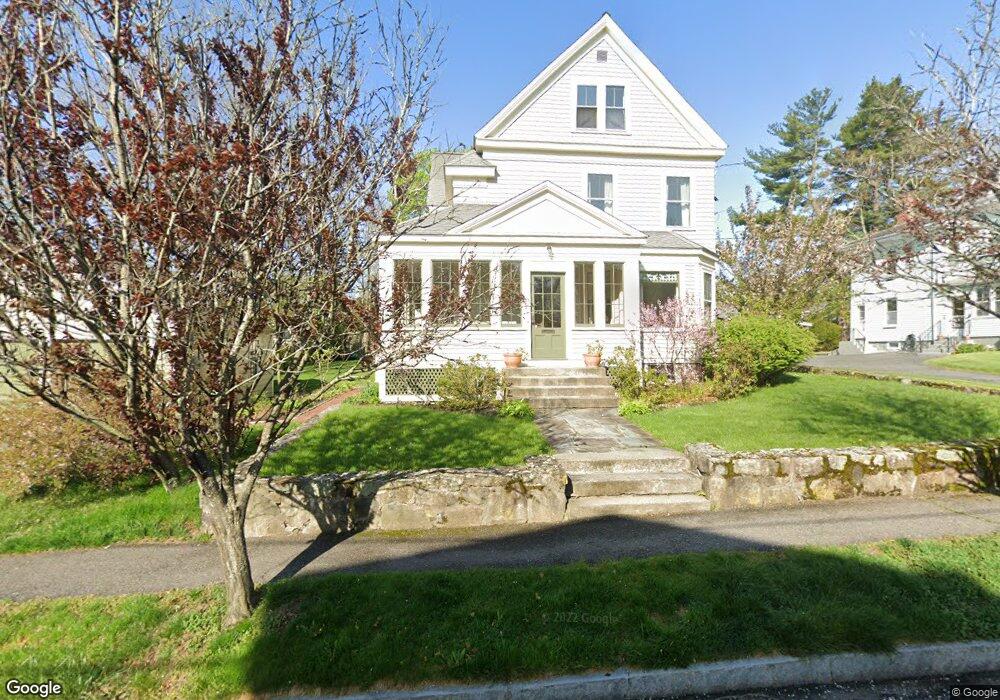
About This Home
This home is located at 11 High St, Natick, MA 01760 and is currently estimated at $1,038,934, approximately $423 per square foot. 11 High St is a home located in Middlesex County with nearby schools including Natick High School, Johnson Elementary School, and J F Kennedy Middle School.
Ownership History
Date
Name
Owned For
Owner Type
Purchase Details
Closed on
Aug 4, 1999
Sold by
Forte Frank
Bought by
Traficonte Jonathan and Traficonte Katherine
Current Estimated Value
Home Financials for this Owner
Home Financials are based on the most recent Mortgage that was taken out on this home.
Original Mortgage
$224,000
Interest Rate
7.54%
Mortgage Type
Purchase Money Mortgage
Create a Home Valuation Report for This Property
The Home Valuation Report is an in-depth analysis detailing your home's value as well as a comparison with similar homes in the area
Home Values in the Area
Average Home Value in this Area
Purchase History
| Date | Buyer | Sale Price | Title Company |
|---|---|---|---|
| Traficonte Jonathan | $280,000 | -- |
Source: Public Records
Mortgage History
| Date | Status | Borrower | Loan Amount |
|---|---|---|---|
| Open | Traficonte Jonathan | $405,000 | |
| Closed | Traficonte Jonathan | $367,000 | |
| Closed | Traficonte Jonathan | $224,000 |
Source: Public Records
Tax History Compared to Growth
Tax History
| Year | Tax Paid | Tax Assessment Tax Assessment Total Assessment is a certain percentage of the fair market value that is determined by local assessors to be the total taxable value of land and additions on the property. | Land | Improvement |
|---|---|---|---|---|
| 2025 | $10,234 | $855,700 | $452,300 | $403,400 |
| 2024 | $9,858 | $804,100 | $427,200 | $376,900 |
| 2023 | $9,659 | $764,200 | $401,900 | $362,300 |
| 2022 | $9,313 | $698,100 | $366,500 | $331,600 |
| 2021 | $5,661 | $658,100 | $346,400 | $311,700 |
| 2020 | $5,455 | $628,000 | $316,300 | $311,700 |
| 2019 | $5,328 | $628,000 | $316,300 | $311,700 |
| 2018 | $8,222 | $630,000 | $301,300 | $328,700 |
| 2017 | $7,950 | $589,300 | $266,600 | $322,700 |
| 2016 | $7,751 | $571,200 | $251,600 | $319,600 |
| 2015 | $7,478 | $541,100 | $251,600 | $289,500 |
Source: Public Records
Map
Nearby Homes
- 58 W Central St
- 63 Pond St
- 98 W Central St
- 25 Forest Ave
- 6 Floral Avenue Extension
- 8 Floral Avenue Extension
- 49 Summer St
- 8 Floral Ave Unit 8
- 16 West St
- 2 Yuba Place
- 38 Washington St Unit 38
- 62 Oakland St
- 216-218 S Main St
- 1 Lincoln Street Extension
- 6B Lincoln St Unit 6B
- 4B Lincoln St Unit 4B
- 5 Wilson St Unit 5A
- 3A Wilson St Unit 3A
- 3 Wilson St Unit 3B
- 11 Avon St