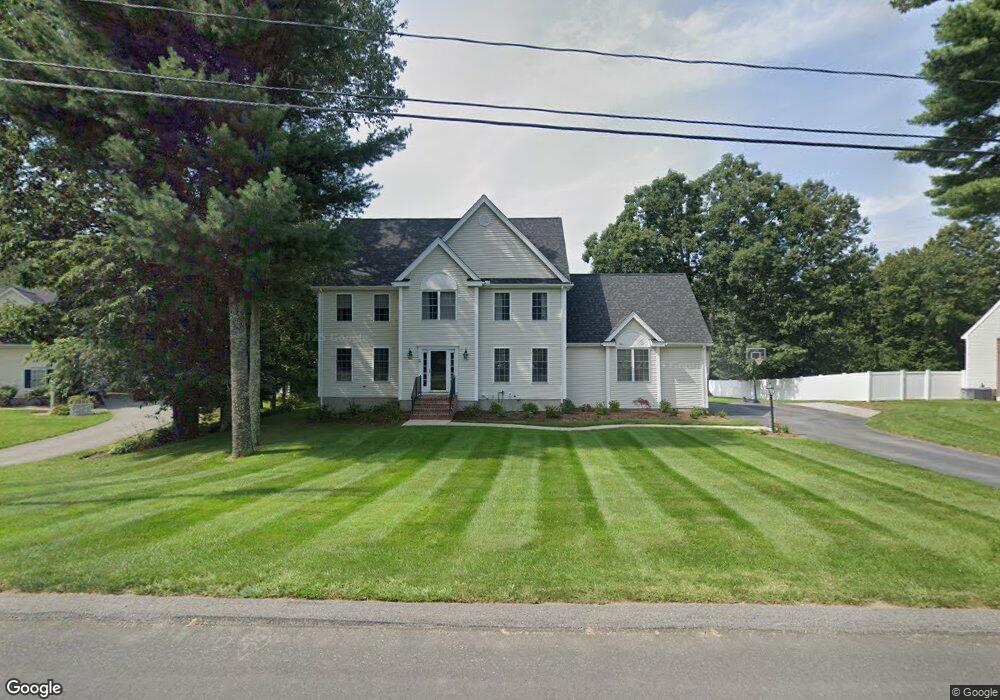
11 Highridge Rd Bellingham, MA 02019
Estimated Value: $897,000 - $964,000
4
Beds
4
Baths
3,700
Sq Ft
$252/Sq Ft
Est. Value
About This Home
This home is located at 11 Highridge Rd, Bellingham, MA 02019 and is currently estimated at $931,755, approximately $251 per square foot. 11 Highridge Rd is a home located in Norfolk County with nearby schools including Joseph F. DiPietro Elementary, Bellingham High School, and Rise Prep Mayoral Academy Middle School.
Ownership History
Date
Name
Owned For
Owner Type
Purchase Details
Closed on
Jun 4, 2008
Sold by
Antonucci Brian C and Antonucci Mary A
Bought by
Carroll Allison and Carroll Michael
Current Estimated Value
Home Financials for this Owner
Home Financials are based on the most recent Mortgage that was taken out on this home.
Original Mortgage
$498,182
Interest Rate
6.11%
Mortgage Type
Purchase Money Mortgage
Purchase Details
Closed on
Feb 13, 2004
Sold by
The Wrentham Group Inc
Bought by
Antonucci Brian C and Antonucci Mary A
Home Financials for this Owner
Home Financials are based on the most recent Mortgage that was taken out on this home.
Original Mortgage
$365,900
Interest Rate
5.82%
Mortgage Type
Purchase Money Mortgage
Purchase Details
Closed on
Nov 7, 2003
Sold by
High Ridge Properties
Bought by
Wrentham Group Inc
Home Financials for this Owner
Home Financials are based on the most recent Mortgage that was taken out on this home.
Original Mortgage
$322,000
Interest Rate
6.01%
Mortgage Type
Purchase Money Mortgage
Create a Home Valuation Report for This Property
The Home Valuation Report is an in-depth analysis detailing your home's value as well as a comparison with similar homes in the area
Home Values in the Area
Average Home Value in this Area
Purchase History
| Date | Buyer | Sale Price | Title Company |
|---|---|---|---|
| Carroll Allison | $506,000 | -- | |
| Antonucci Brian C | $459,000 | -- | |
| Wrentham Group Inc | $165,000 | -- |
Source: Public Records
Mortgage History
| Date | Status | Borrower | Loan Amount |
|---|---|---|---|
| Open | Wrentham Group Inc | $502,120 | |
| Closed | Carroll Allison | $498,182 | |
| Previous Owner | Antonucci Brian C | $365,900 | |
| Previous Owner | Wrentham Group Inc | $322,000 |
Source: Public Records
Tax History Compared to Growth
Tax History
| Year | Tax Paid | Tax Assessment Tax Assessment Total Assessment is a certain percentage of the fair market value that is determined by local assessors to be the total taxable value of land and additions on the property. | Land | Improvement |
|---|---|---|---|---|
| 2025 | $9,695 | $771,900 | $183,100 | $588,800 |
| 2024 | $9,254 | $719,600 | $167,200 | $552,400 |
| 2023 | $8,805 | $674,700 | $159,200 | $515,500 |
| 2022 | $8,775 | $623,200 | $138,700 | $484,500 |
| 2021 | $8,438 | $585,600 | $138,700 | $446,900 |
| 2020 | $8,091 | $569,000 | $136,600 | $432,400 |
| 2019 | $7,925 | $557,700 | $136,600 | $421,100 |
| 2018 | $7,623 | $529,000 | $148,500 | $380,500 |
| 2017 | $7,378 | $514,500 | $148,500 | $366,000 |
| 2016 | $6,979 | $488,400 | $157,100 | $331,300 |
| 2015 | $6,951 | $487,800 | $157,100 | $330,700 |
| 2014 | $6,820 | $465,200 | $152,800 | $312,400 |
Source: Public Records
Map
Nearby Homes
- 352 Lake St
- 1250 Pulaski Blvd
- 124 Lake St
- 66 Newland Ave
- 17 Susan Ln
- 8 Bubbling Brook Rd
- 0 Prospect St
- 1 Clover Dr
- 65 Palmetto Dr Unit 65
- 21 Palmetto Dr Unit 21
- 29 Squire Ln
- 6 Fleuette Dr
- 24 Palmetto Dr Unit 24
- 26 Iris Ln
- 9 Pebble Cir Unit 9
- 340 Wrentham Rd
- 851 Washington St
- 89 Lakeview Ave
- 4 Little Tree Ln
- 19 Geordan Ave
- 9 Highridge Rd
- 13 Highridge Rd
- 14 Highridge Rd
- 7 Highridge Rd
- 15 Highridge Rd
- 16 Highridge Rd
- 12 Highridge Rd
- 5 Highridge Rd
- 17 Highridge Rd
- 18 Highridge Rd
- 1 Rhodes Way
- 10 Highridge Rd
- 3 Highridge Rd
- 19 Highridge Rd
- 20 Highridge Rd
- 8 Highridge Rd
- 6 Highridge Rd Unit 60
- 6 Highridge Rd
- 60 Highridge Rd
- 4 Rhodes Way