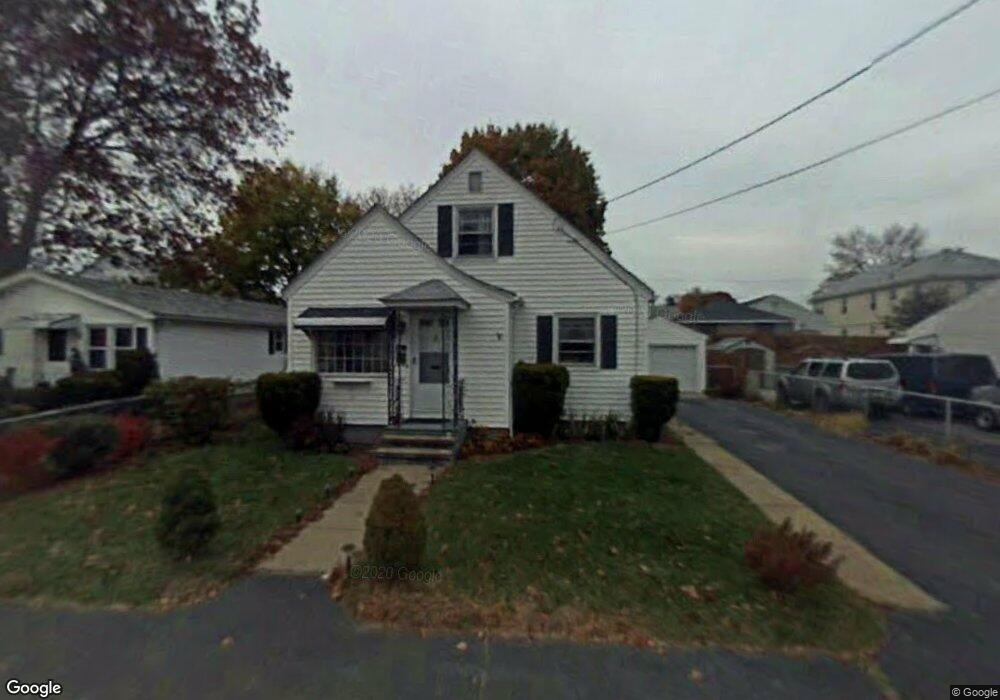
11 Hobson Ave Cranston, RI 02910
Spectacle NeighborhoodEstimated Value: $333,000 - $394,000
2
Beds
1
Bath
1,250
Sq Ft
$289/Sq Ft
Est. Value
About This Home
This home is located at 11 Hobson Ave, Cranston, RI 02910 and is currently estimated at $361,867, approximately $289 per square foot. 11 Hobson Ave is a home located in Providence County with nearby schools including Stadium Elementary School, Hugh B. Bain Middle School, and Cranston High School East.
Ownership History
Date
Name
Owned For
Owner Type
Purchase Details
Closed on
Jan 2, 2004
Sold by
Pena Nelly
Bought by
Eighme Gregory
Current Estimated Value
Purchase Details
Closed on
Mar 22, 2001
Sold by
Nieratko Anna H
Bought by
Pena Nelly
Home Financials for this Owner
Home Financials are based on the most recent Mortgage that was taken out on this home.
Original Mortgage
$89,900
Interest Rate
6.93%
Create a Home Valuation Report for This Property
The Home Valuation Report is an in-depth analysis detailing your home's value as well as a comparison with similar homes in the area
Home Values in the Area
Average Home Value in this Area
Purchase History
| Date | Buyer | Sale Price | Title Company |
|---|---|---|---|
| Eighme Gregory | $165,000 | -- | |
| Pena Nelly | $100,000 | -- |
Source: Public Records
Mortgage History
| Date | Status | Borrower | Loan Amount |
|---|---|---|---|
| Previous Owner | Pena Nelly | $89,900 |
Source: Public Records
Tax History Compared to Growth
Tax History
| Year | Tax Paid | Tax Assessment Tax Assessment Total Assessment is a certain percentage of the fair market value that is determined by local assessors to be the total taxable value of land and additions on the property. | Land | Improvement |
|---|---|---|---|---|
| 2025 | $4,206 | $303,000 | $95,700 | $207,300 |
| 2024 | $4,093 | $300,700 | $95,700 | $205,000 |
| 2023 | $3,910 | $206,900 | $66,000 | $140,900 |
| 2022 | $3,830 | $206,900 | $66,000 | $140,900 |
| 2021 | $3,724 | $206,900 | $66,000 | $140,900 |
| 2020 | $3,535 | $170,200 | $62,700 | $107,500 |
| 2019 | $3,535 | $170,200 | $62,700 | $107,500 |
| 2018 | $3,453 | $170,200 | $62,700 | $107,500 |
| 2017 | $3,127 | $136,300 | $46,200 | $90,100 |
| 2016 | $3,060 | $136,300 | $46,200 | $90,100 |
| 2015 | $3,060 | $136,300 | $46,200 | $90,100 |
| 2014 | $3,131 | $137,100 | $46,200 | $90,900 |
Source: Public Records
Map
Nearby Homes