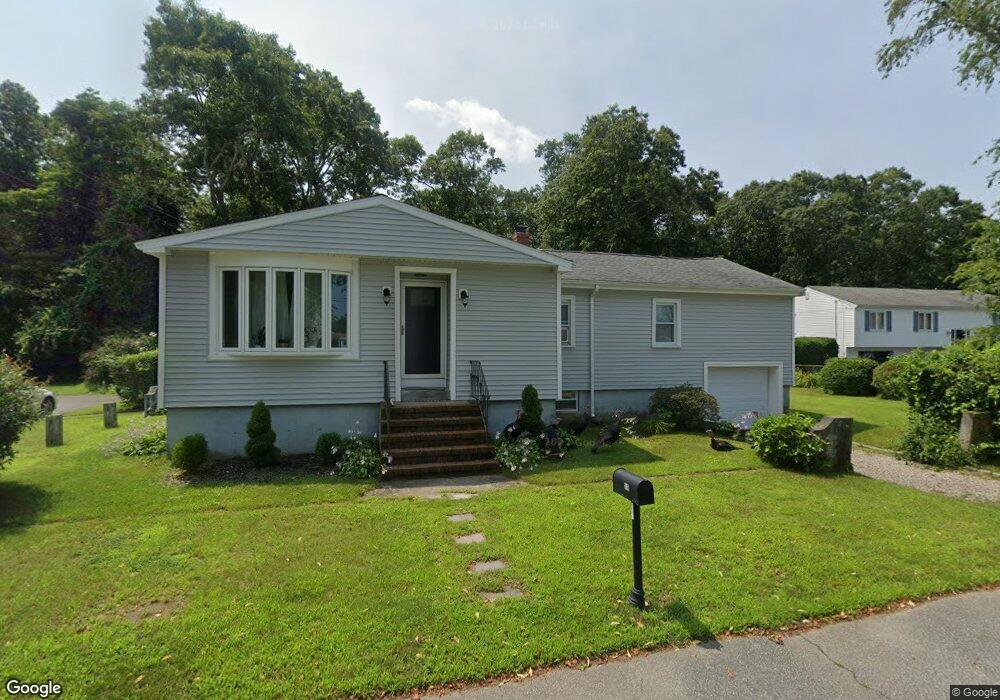
11 Holland St South Dartmouth, MA 02748
Bliss Corner NeighborhoodEstimated Value: $392,000 - $463,000
3
Beds
1
Bath
1,190
Sq Ft
$364/Sq Ft
Est. Value
About This Home
This home is located at 11 Holland St, South Dartmouth, MA 02748 and is currently estimated at $433,279, approximately $364 per square foot. 11 Holland St is a home located in Bristol County with nearby schools including Dartmouth High School, St. Teresa of Calcutta School, and Our Sister's School.
Ownership History
Date
Name
Owned For
Owner Type
Purchase Details
Closed on
May 31, 2006
Sold by
Rocha George and Rocha Louis J
Bought by
Benoit Adam D and Rocha Jaclyn M
Current Estimated Value
Home Financials for this Owner
Home Financials are based on the most recent Mortgage that was taken out on this home.
Original Mortgage
$196,000
Interest Rate
6.55%
Mortgage Type
Purchase Money Mortgage
Purchase Details
Closed on
Aug 3, 2004
Sold by
Rocha Almarinda
Bought by
Rocha George and Rocha Louis J
Create a Home Valuation Report for This Property
The Home Valuation Report is an in-depth analysis detailing your home's value as well as a comparison with similar homes in the area
Home Values in the Area
Average Home Value in this Area
Purchase History
| Date | Buyer | Sale Price | Title Company |
|---|---|---|---|
| Benoit Adam D | $245,000 | -- | |
| Rocha George | $100,750 | -- |
Source: Public Records
Mortgage History
| Date | Status | Borrower | Loan Amount |
|---|---|---|---|
| Open | Rocha George | $193,000 | |
| Closed | Rocha George | $196,000 | |
| Closed | Rocha George | $49,000 |
Source: Public Records
Tax History Compared to Growth
Tax History
| Year | Tax Paid | Tax Assessment Tax Assessment Total Assessment is a certain percentage of the fair market value that is determined by local assessors to be the total taxable value of land and additions on the property. | Land | Improvement |
|---|---|---|---|---|
| 2025 | $2,581 | $299,800 | $112,700 | $187,100 |
| 2024 | $2,487 | $286,200 | $106,400 | $179,800 |
| 2023 | $2,465 | $268,800 | $106,400 | $162,400 |
| 2022 | $2,391 | $241,500 | $106,400 | $135,100 |
| 2021 | $2,027 | $195,700 | $91,100 | $104,600 |
| 2020 | $2,088 | $201,200 | $100,900 | $100,300 |
| 2019 | $2,296 | $220,800 | $121,500 | $99,300 |
| 2018 | $4,257 | $209,700 | $121,500 | $88,200 |
| 2017 | $2,019 | $201,500 | $114,600 | $86,900 |
| 2016 | $1,994 | $196,300 | $114,600 | $81,700 |
| 2015 | $1,928 | $190,100 | $107,100 | $83,000 |
| 2014 | $1,824 | $178,600 | $97,200 | $81,400 |
Source: Public Records
Map
Nearby Homes