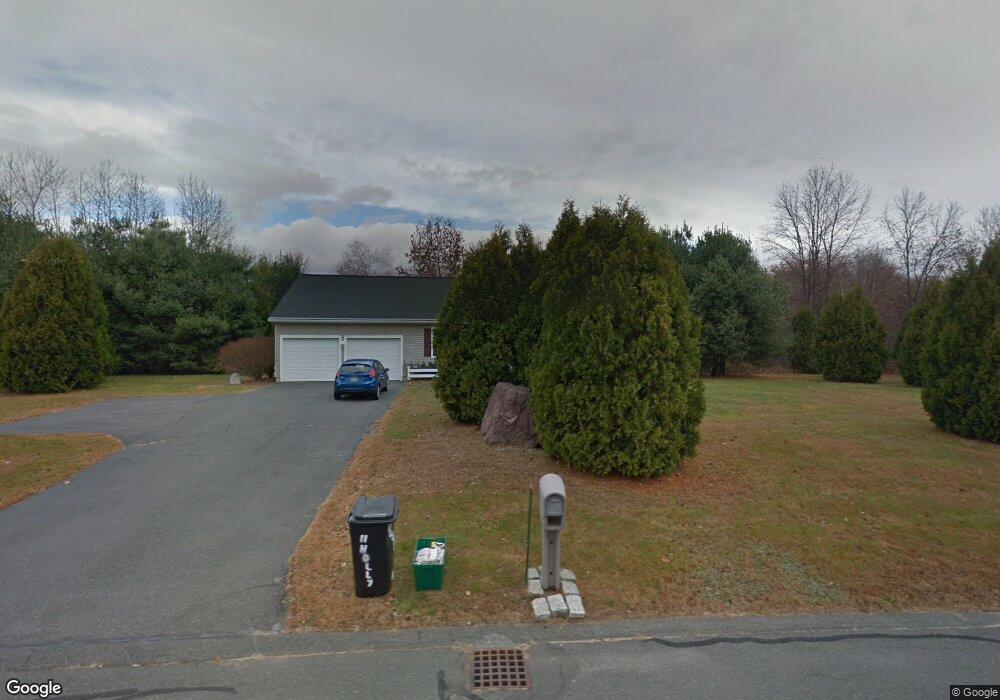
11 Holly Cir Unit 15 Easthampton, MA 01027
Estimated Value: $529,000 - $748,000
8
Beds
4
Baths
3,444
Sq Ft
$177/Sq Ft
Est. Value
About This Home
This home is located at 11 Holly Cir Unit 15, Easthampton, MA 01027 and is currently estimated at $608,277, approximately $176 per square foot. 11 Holly Cir Unit 15 is a home located in Hampshire County with nearby schools including Easthampton High School, Hilltown Cooperative Charter Public School, and Calvary Baptist Christian School.
Ownership History
Date
Name
Owned For
Owner Type
Purchase Details
Closed on
Jul 7, 2016
Sold by
Est Briere Eugene A and Parsons Patricia J
Bought by
Lafond Ian and Lafond Diane
Current Estimated Value
Home Financials for this Owner
Home Financials are based on the most recent Mortgage that was taken out on this home.
Original Mortgage
$261,250
Outstanding Balance
$208,959
Interest Rate
3.64%
Mortgage Type
New Conventional
Estimated Equity
$399,318
Purchase Details
Closed on
Mar 19, 1999
Sold by
Emerson Donald C and Marek Walter L
Bought by
Briere Eugene A and Briere Joan P
Home Financials for this Owner
Home Financials are based on the most recent Mortgage that was taken out on this home.
Original Mortgage
$140,800
Interest Rate
6.74%
Create a Home Valuation Report for This Property
The Home Valuation Report is an in-depth analysis detailing your home's value as well as a comparison with similar homes in the area
Home Values in the Area
Average Home Value in this Area
Purchase History
| Date | Buyer | Sale Price | Title Company |
|---|---|---|---|
| Lafond Ian | $275,000 | -- | |
| Briere Eugene A | $179,372 | -- |
Source: Public Records
Mortgage History
| Date | Status | Borrower | Loan Amount |
|---|---|---|---|
| Open | Lafond Ian | $261,250 | |
| Previous Owner | Briere Eugene A | $140,800 |
Source: Public Records
Tax History Compared to Growth
Tax History
| Year | Tax Paid | Tax Assessment Tax Assessment Total Assessment is a certain percentage of the fair market value that is determined by local assessors to be the total taxable value of land and additions on the property. | Land | Improvement |
|---|---|---|---|---|
| 2025 | $7,071 | $517,300 | $146,700 | $370,600 |
| 2024 | $6,827 | $503,500 | $142,400 | $361,100 |
| 2023 | $5,012 | $342,100 | $112,900 | $229,200 |
| 2022 | $5,655 | $342,100 | $112,900 | $229,200 |
| 2021 | $6,200 | $353,500 | $112,900 | $240,600 |
| 2020 | $6,076 | $342,100 | $112,900 | $229,200 |
| 2019 | $5,363 | $346,900 | $131,400 | $215,500 |
| 2018 | $5,066 | $316,600 | $124,000 | $192,600 |
| 2017 | $4,701 | $290,000 | $119,100 | $170,900 |
| 2016 | $4,668 | $299,400 | $119,100 | $180,300 |
| 2015 | $4,536 | $299,400 | $119,100 | $180,300 |
Source: Public Records
Map
Nearby Homes