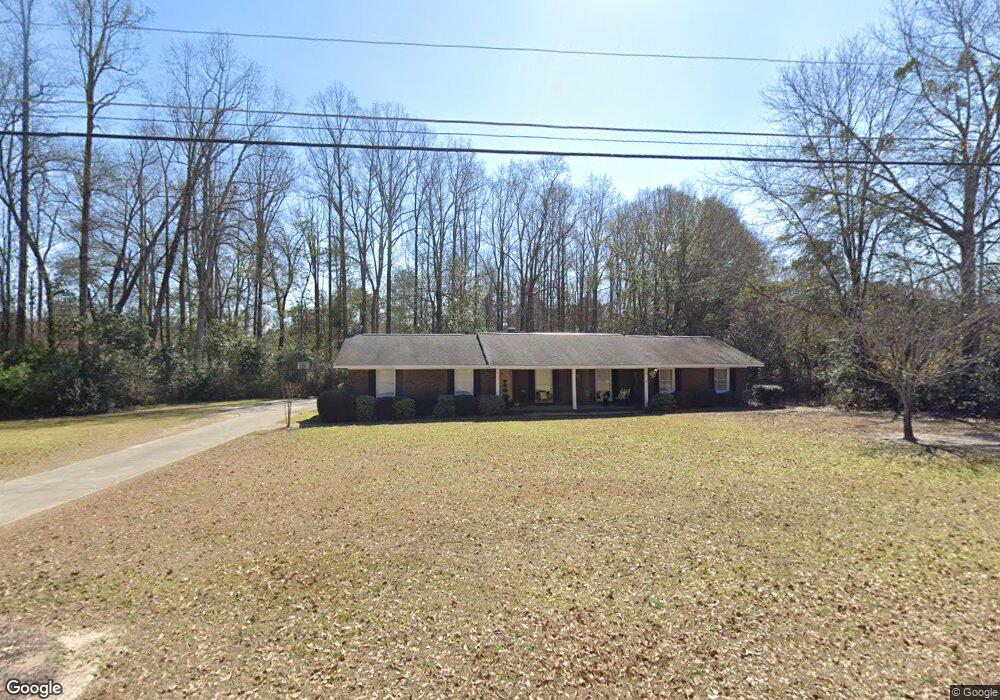
11 Honeysuckle Ln Mc Rae, GA 31055
Estimated Value: $184,842 - $206,000
--
Bed
2
Baths
2,089
Sq Ft
$93/Sq Ft
Est. Value
About This Home
This home is located at 11 Honeysuckle Ln, Mc Rae, GA 31055 and is currently estimated at $194,961, approximately $93 per square foot. 11 Honeysuckle Ln is a home located in Telfair County with nearby schools including Telfair County Elementary School, Telfair County Middle School, and Telfair County High School.
Ownership History
Date
Name
Owned For
Owner Type
Purchase Details
Closed on
Feb 12, 2016
Sold by
Ray Daymond
Bought by
Hattaway Jordan Lajoy
Current Estimated Value
Home Financials for this Owner
Home Financials are based on the most recent Mortgage that was taken out on this home.
Original Mortgage
$116,535
Interest Rate
3.92%
Mortgage Type
New Conventional
Purchase Details
Closed on
Mar 13, 2012
Sold by
Hutcheson Karen
Bought by
Ray Daymond
Purchase Details
Closed on
May 28, 2010
Sold by
Hutcheson Casey M
Bought by
Hutcheson Karen and Chandler Morgan Hutcheson Trust
Purchase Details
Closed on
Jun 5, 2007
Sold by
Bland Roy A
Bought by
Deutsche Bank National Trust C
Purchase Details
Closed on
Jan 26, 2001
Sold by
Bland Roy A
Bought by
Bland Roy A and Bland Beth R
Create a Home Valuation Report for This Property
The Home Valuation Report is an in-depth analysis detailing your home's value as well as a comparison with similar homes in the area
Home Values in the Area
Average Home Value in this Area
Purchase History
| Date | Buyer | Sale Price | Title Company |
|---|---|---|---|
| Hattaway Jordan Lajoy | $115,000 | -- | |
| Ray Daymond | $116,000 | -- | |
| Hutcheson Karen | -- | -- | |
| Deutsche Bank National Trust C | $63,750 | -- | |
| Bland Roy A | -- | -- |
Source: Public Records
Mortgage History
| Date | Status | Borrower | Loan Amount |
|---|---|---|---|
| Closed | Hattaway Jordan Lajoy | $116,535 |
Source: Public Records
Tax History Compared to Growth
Tax History
| Year | Tax Paid | Tax Assessment Tax Assessment Total Assessment is a certain percentage of the fair market value that is determined by local assessors to be the total taxable value of land and additions on the property. | Land | Improvement |
|---|---|---|---|---|
| 2024 | $2,405 | $59,579 | $4,107 | $55,472 |
| 2023 | $2,303 | $56,925 | $4,107 | $52,818 |
| 2022 | $1,695 | $56,925 | $4,107 | $52,818 |
| 2021 | $1,232 | $39,391 | $4,107 | $35,284 |
| 2020 | $1,152 | $36,211 | $4,107 | $32,104 |
| 2019 | $1,158 | $36,211 | $4,107 | $32,104 |
| 2018 | $1,580 | $36,670 | $4,107 | $32,563 |
| 2017 | $1,008 | $33,638 | $3,832 | $29,806 |
| 2016 | $1,008 | $33,638 | $3,832 | $29,806 |
| 2015 | -- | $33,638 | $3,832 | $29,806 |
| 2014 | -- | $36,321 | $3,832 | $32,489 |
| 2013 | -- | $36,680 | $3,832 | $32,848 |
Source: Public Records
Map
Nearby Homes
- 141 S First Ave
- 78 S Second Ave
- 15 Ben Ave
- 125 Fifth Ave
- 210 W Graham St
- 0 Ll350 & 398 7th District Unit 30490
- 47 S First Ave
- 27 E Bruce St
- 160 E Willow Creek Ln
- 17 2nd St
- 36 Strozier St
- 0 Jackson Ave Unit 10548102
- 0 Bonaire St Unit 10647239
- Lot 126 Pansy Ln
- 76 E Grant St
- 427 3rd Ave
- 22 Spring Ave
- 0 Center Ave
- 0 U S 23
- 00 U S 341
- 0 Honeysuckle Ln
- 19 Honeysuckle Ln
- 73 W Willow Creek Ln
- 4 Honeysuckle Ln
- 4 Honeysuckle Ln
- 25 Honeysuckle Ln
- W W Willow Creek Ln Unit 1 ACRE
- W W Willow Creek Ln Unit 2
- W W Willow Creek Ln
- 12 Walker Ln
- 95 W Willow Creek Ln
- 28 Honeysuckle Ln
- 70 W Willow Creek Ln
- 66 W Willow Creek Ln
- 89 W Poplar St
- 13 Walker Ln
- 96 W Willow Creek Ln
- 103 W Willow Creek Ln Unit 2
- 103 W Willow Creek Ln
- 18 Walker Ln