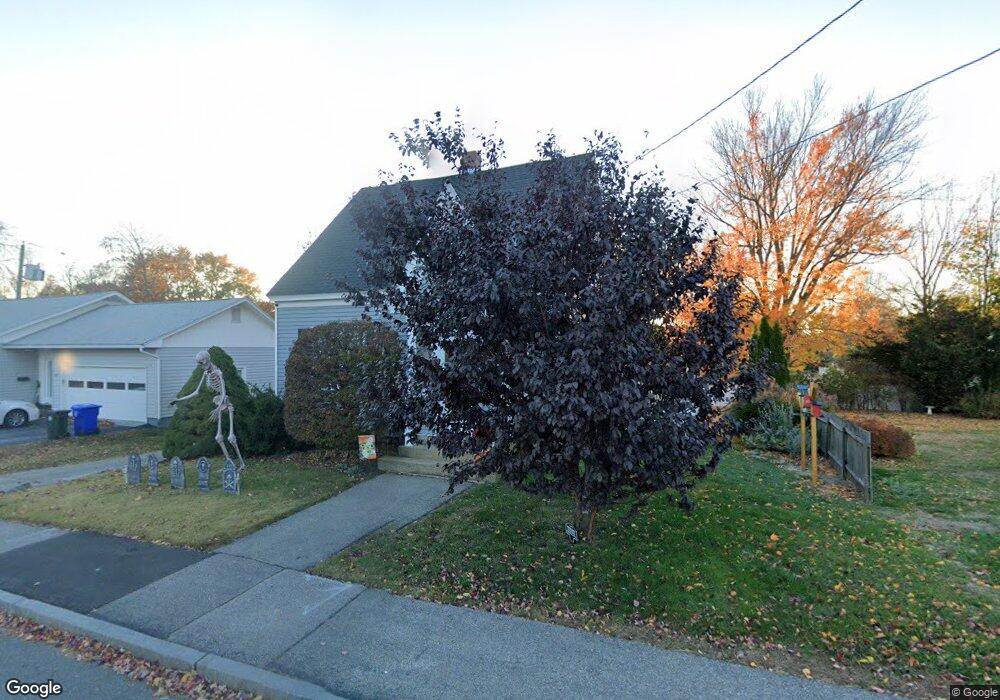
11 Huse Rd Manchester, NH 03103
Southside NeighborhoodEstimated Value: $380,126 - $427,000
2
Beds
2
Baths
1,032
Sq Ft
$390/Sq Ft
Est. Value
About This Home
This home is located at 11 Huse Rd, Manchester, NH 03103 and is currently estimated at $402,782, approximately $390 per square foot. 11 Huse Rd is a home located in Hillsborough County with nearby schools including Henry J. McLaughlin Middle School, Manchester Memorial High School, and Cardinal Lacroix Academy.
Ownership History
Date
Name
Owned For
Owner Type
Purchase Details
Closed on
Jan 10, 2022
Sold by
Chalifour Jessica F and Molloy Aaron
Bought by
Molloy Jessica and Mollow Aaron
Current Estimated Value
Home Financials for this Owner
Home Financials are based on the most recent Mortgage that was taken out on this home.
Original Mortgage
$178,700
Outstanding Balance
$164,694
Interest Rate
3.11%
Mortgage Type
Stand Alone Refi Refinance Of Original Loan
Estimated Equity
$238,088
Purchase Details
Closed on
Apr 29, 2009
Sold by
Lafond Conrad E
Bought by
Chalifour Jessica F and Molloy Aaron T
Home Financials for this Owner
Home Financials are based on the most recent Mortgage that was taken out on this home.
Original Mortgage
$161,029
Interest Rate
4.86%
Mortgage Type
Purchase Money Mortgage
Purchase Details
Closed on
Oct 21, 2008
Sold by
Lacroix-Sinclair Roxanne
Bought by
Lafond Conrad E
Create a Home Valuation Report for This Property
The Home Valuation Report is an in-depth analysis detailing your home's value as well as a comparison with similar homes in the area
Home Values in the Area
Average Home Value in this Area
Purchase History
| Date | Buyer | Sale Price | Title Company |
|---|---|---|---|
| Molloy Jessica | -- | None Available | |
| Molloy Jessica | -- | None Available | |
| Chalifour Jessica F | $164,000 | -- | |
| Lafond Conrad E | $100,000 | -- | |
| Chalifour Jessica F | $164,000 | -- | |
| Lafond Conrad E | $100,000 | -- |
Source: Public Records
Mortgage History
| Date | Status | Borrower | Loan Amount |
|---|---|---|---|
| Open | Molloy Jessica | $178,700 | |
| Closed | Molloy Jessica | $178,700 | |
| Previous Owner | Lafond Conrad E | $161,029 |
Source: Public Records
Tax History Compared to Growth
Tax History
| Year | Tax Paid | Tax Assessment Tax Assessment Total Assessment is a certain percentage of the fair market value that is determined by local assessors to be the total taxable value of land and additions on the property. | Land | Improvement |
|---|---|---|---|---|
| 2024 | $4,595 | $234,700 | $99,800 | $134,900 |
| 2023 | $4,426 | $234,700 | $99,800 | $134,900 |
| 2022 | $4,281 | $234,700 | $99,800 | $134,900 |
| 2021 | $4,149 | $234,700 | $99,800 | $134,900 |
| 2020 | $3,857 | $156,400 | $68,800 | $87,600 |
| 2019 | $3,804 | $156,400 | $68,800 | $87,600 |
| 2018 | $3,661 | $156,400 | $68,800 | $87,600 |
| 2017 | $3,602 | $156,400 | $68,800 | $87,600 |
| 2016 | $3,619 | $156,400 | $68,800 | $87,600 |
| 2015 | $3,528 | $150,500 | $63,700 | $86,800 |
| 2014 | $3,537 | $150,500 | $63,700 | $86,800 |
| 2013 | $3,412 | $150,500 | $63,700 | $86,800 |
Source: Public Records
Map
Nearby Homes