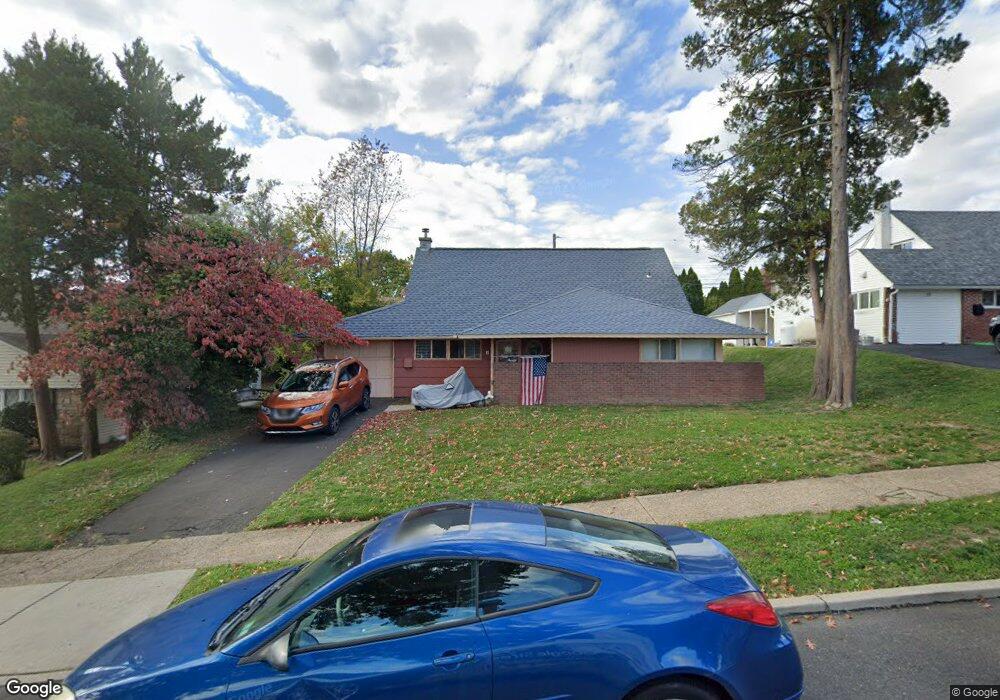
11 Hydrangea Rd Levittown, PA 19056
Highland Park NeighborhoodEstimated Value: $388,000 - $450,000
3
Beds
2
Baths
1,529
Sq Ft
$270/Sq Ft
Est. Value
About This Home
This home is located at 11 Hydrangea Rd, Levittown, PA 19056 and is currently estimated at $413,574, approximately $270 per square foot. 11 Hydrangea Rd is a home located in Bucks County with nearby schools including Albert Schweitzer Elementary School, Sandburg Middle School, and Neshaminy High School.
Ownership History
Date
Name
Owned For
Owner Type
Purchase Details
Closed on
Mar 30, 1999
Sold by
Armstrong Joan F
Bought by
Arrendell Manuel and Arrendell Leticia
Current Estimated Value
Home Financials for this Owner
Home Financials are based on the most recent Mortgage that was taken out on this home.
Original Mortgage
$118,030
Outstanding Balance
$29,366
Interest Rate
6.83%
Mortgage Type
FHA
Estimated Equity
$384,208
Purchase Details
Closed on
Apr 4, 1962
Bought by
Armstrong Wm R and Armstrong Joan F
Create a Home Valuation Report for This Property
The Home Valuation Report is an in-depth analysis detailing your home's value as well as a comparison with similar homes in the area
Home Values in the Area
Average Home Value in this Area
Purchase History
| Date | Buyer | Sale Price | Title Company |
|---|---|---|---|
| Arrendell Manuel | $123,000 | T A Title Insurance Company | |
| Armstrong Wm R | -- | -- |
Source: Public Records
Mortgage History
| Date | Status | Borrower | Loan Amount |
|---|---|---|---|
| Open | Arrendell Manuel | $118,030 |
Source: Public Records
Tax History
| Year | Tax Paid | Tax Assessment Tax Assessment Total Assessment is a certain percentage of the fair market value that is determined by local assessors to be the total taxable value of land and additions on the property. | Land | Improvement |
|---|---|---|---|---|
| 2025 | $4,615 | $21,200 | $4,320 | $16,880 |
| 2024 | $4,615 | $21,200 | $4,320 | $16,880 |
| 2023 | $4,542 | $21,200 | $4,320 | $16,880 |
| 2022 | $4,423 | $21,200 | $4,320 | $16,880 |
| 2021 | $4,423 | $21,200 | $4,320 | $16,880 |
| 2020 | $4,370 | $21,200 | $4,320 | $16,880 |
| 2019 | $4,272 | $21,200 | $4,320 | $16,880 |
| 2018 | $4,194 | $21,200 | $4,320 | $16,880 |
| 2017 | $4,087 | $21,200 | $4,320 | $16,880 |
| 2016 | $4,087 | $21,200 | $4,320 | $16,880 |
| 2015 | $4,276 | $21,200 | $4,320 | $16,880 |
| 2014 | $4,276 | $21,200 | $4,320 | $16,880 |
Source: Public Records
Map
Nearby Homes
- 46 Hydrangea Rd
- 80 Silverspruce Rd
- 55 Hollow Rd
- 14 High Rd
- L:070 Trenton Rd
- 169 Forsythia Dr N
- 0 Fir Ave
- 27 Spicebush Rd
- 29 Spindletree Rd
- 51 Hollybrooke Dr
- 428 Madison Ave
- 24 Rose Apple Rd
- 56 W Lincoln Hwy
- 90 Cobalt Ridge Dr E Unit E
- 5 June Rd
- 18 Jump Hill Rd
- 43 Tweed Rd
- 711 Bellevue Ave
- 164 Trenton Rd
- 0 Highland Ave E Unit PABU2111912
Your Personal Tour Guide
Ask me questions while you tour the home.