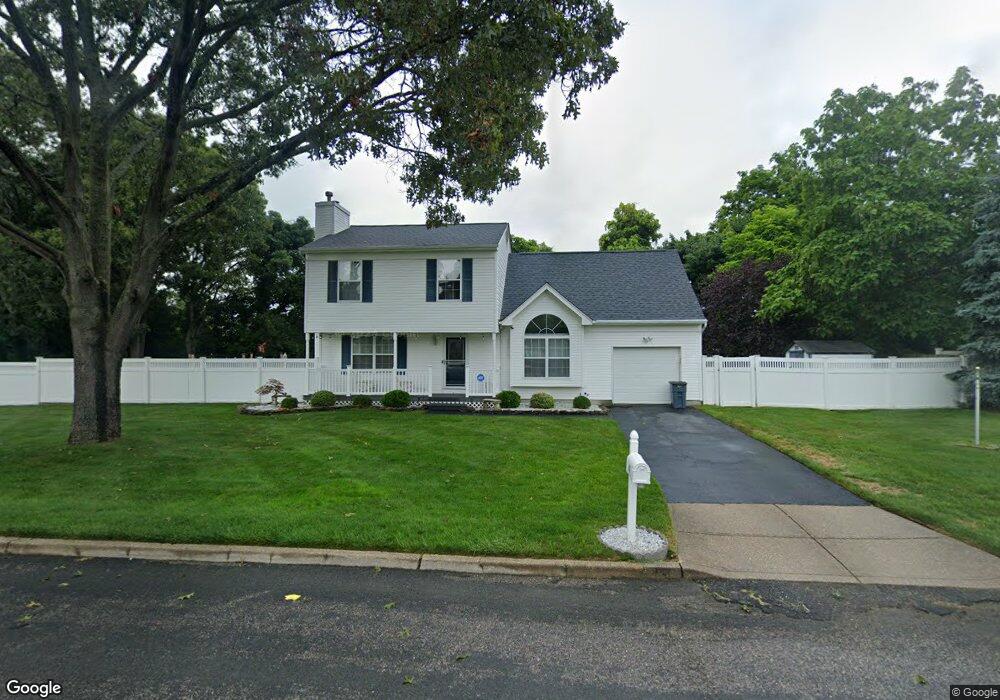
11 John St Selden, NY 11784
Estimated Value: $613,926 - $665,000
3
Beds
2
Baths
1,507
Sq Ft
$427/Sq Ft
Est. Value
About This Home
This home is located at 11 John St, Selden, NY 11784 and is currently estimated at $643,482, approximately $426 per square foot. 11 John St is a home located in Suffolk County with nearby schools including Our Savior New American School.
Ownership History
Date
Name
Owned For
Owner Type
Purchase Details
Closed on
Nov 7, 2017
Sold by
Lester Barbara and Williams Jo
Bought by
Heiser Robert J and Heiser Rosemarie T
Current Estimated Value
Home Financials for this Owner
Home Financials are based on the most recent Mortgage that was taken out on this home.
Original Mortgage
$348,570
Outstanding Balance
$285,393
Interest Rate
3.87%
Mortgage Type
FHA
Estimated Equity
$358,089
Purchase Details
Closed on
May 12, 1998
Sold by
Crystal Bay Construction Inc
Bought by
Leste Barbara and Williams Jo
Home Financials for this Owner
Home Financials are based on the most recent Mortgage that was taken out on this home.
Original Mortgage
$145,000
Interest Rate
7.03%
Purchase Details
Closed on
Feb 7, 1997
Sold by
Rois Corp
Bought by
Crystal Bay Construction Inc
Create a Home Valuation Report for This Property
The Home Valuation Report is an in-depth analysis detailing your home's value as well as a comparison with similar homes in the area
Home Values in the Area
Average Home Value in this Area
Purchase History
| Date | Buyer | Sale Price | Title Company |
|---|---|---|---|
| Heiser Robert J | $355,000 | -- | |
| Leste Barbara | $165,000 | Chicago Title Insurance Co | |
| Crystal Bay Construction Inc | $30,000 | Chicago Title Insurance Co |
Source: Public Records
Mortgage History
| Date | Status | Borrower | Loan Amount |
|---|---|---|---|
| Open | Heiser Robert J | $348,570 | |
| Previous Owner | Leste Barbara | $145,000 |
Source: Public Records
Tax History
| Year | Tax Paid | Tax Assessment Tax Assessment Total Assessment is a certain percentage of the fair market value that is determined by local assessors to be the total taxable value of land and additions on the property. | Land | Improvement |
|---|---|---|---|---|
| 2024 | $13,747 | $2,800 | $250 | $2,550 |
| 2023 | $13,747 | $2,800 | $250 | $2,550 |
| 2022 | $11,440 | $2,800 | $250 | $2,550 |
| 2021 | $11,440 | $2,800 | $250 | $2,550 |
| 2020 | $11,953 | $2,800 | $250 | $2,550 |
| 2019 | $11,953 | $0 | $0 | $0 |
| 2018 | $10,022 | $2,800 | $250 | $2,550 |
| 2017 | $10,022 | $2,800 | $250 | $2,550 |
| 2016 | $9,997 | $2,800 | $250 | $2,550 |
| 2015 | -- | $2,800 | $250 | $2,550 |
| 2014 | -- | $2,800 | $250 | $2,550 |
Source: Public Records
Map
Nearby Homes
Your Personal Tour Guide
Ask me questions while you tour the home.