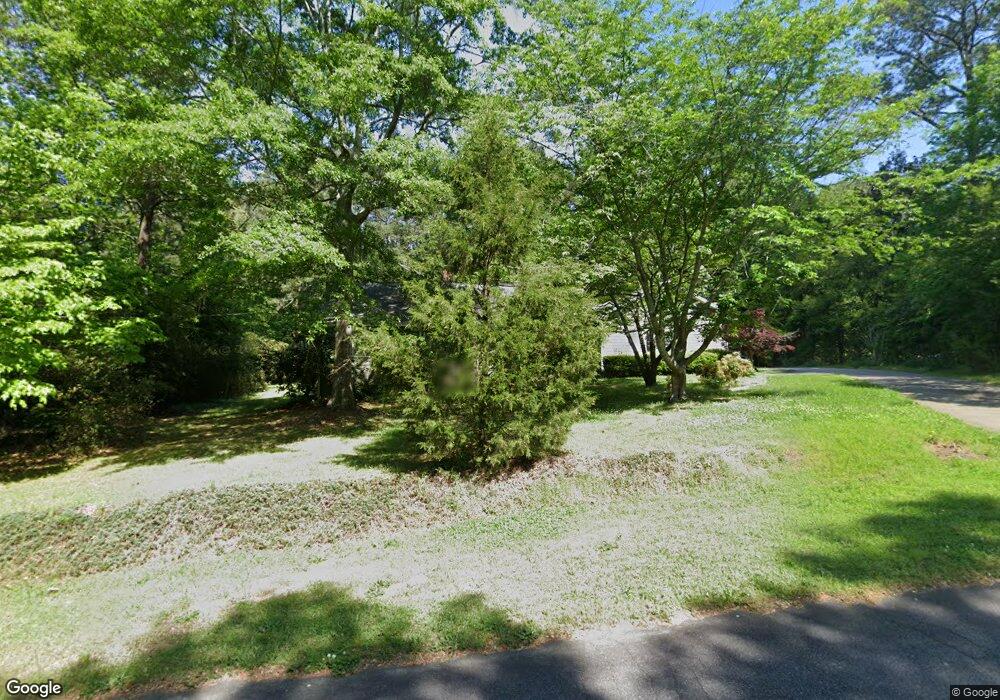
11 John St Winder, GA 30680
Estimated Value: $319,321 - $365,000
3
Beds
2
Baths
2,180
Sq Ft
$159/Sq Ft
Est. Value
About This Home
This home is located at 11 John St, Winder, GA 30680 and is currently estimated at $347,580, approximately $159 per square foot. 11 John St is a home located in Barrow County with nearby schools including Holsenbeck Elementary School, Bear Creek Middle School, and Winder-Barrow High School.
Ownership History
Date
Name
Owned For
Owner Type
Purchase Details
Closed on
May 30, 2008
Sold by
Spurlin Earlene L
Bought by
Turnbull Jerry W
Current Estimated Value
Purchase Details
Closed on
Dec 2, 2003
Sold by
Spurlin Robert G
Bought by
Spurlin Earlene L
Purchase Details
Closed on
Dec 28, 2000
Sold by
Guzman Michael F
Bought by
Spurlin Robert G and Spurlin Earlene L
Home Financials for this Owner
Home Financials are based on the most recent Mortgage that was taken out on this home.
Original Mortgage
$110,000
Interest Rate
7.75%
Mortgage Type
New Conventional
Purchase Details
Closed on
Sep 8, 1995
Sold by
Whitlock Ronald Janice
Bought by
Guzman Michael
Purchase Details
Closed on
Apr 2, 1983
Bought by
Whitlock Ronald Gary
Create a Home Valuation Report for This Property
The Home Valuation Report is an in-depth analysis detailing your home's value as well as a comparison with similar homes in the area
Home Values in the Area
Average Home Value in this Area
Purchase History
| Date | Buyer | Sale Price | Title Company |
|---|---|---|---|
| Turnbull Jerry W | $150,000 | -- | |
| Spurlin Earlene L | -- | -- | |
| Spurlin Robert G | $140,000 | -- | |
| Guzman Michael | $95,000 | -- | |
| Whitlock Ronald Gary | $7,000 | -- |
Source: Public Records
Mortgage History
| Date | Status | Borrower | Loan Amount |
|---|---|---|---|
| Previous Owner | Spurlin Robert G | $110,000 | |
| Closed | Guzman Michael | $0 |
Source: Public Records
Tax History
| Year | Tax Paid | Tax Assessment Tax Assessment Total Assessment is a certain percentage of the fair market value that is determined by local assessors to be the total taxable value of land and additions on the property. | Land | Improvement |
|---|---|---|---|---|
| 2025 | $913 | $81,892 | $12,000 | $69,892 |
| 2024 | $894 | $79,964 | $12,000 | $67,964 |
| 2023 | $701 | $79,964 | $12,000 | $67,964 |
| 2022 | $782 | $56,448 | $12,000 | $44,448 |
| 2021 | $716 | $56,448 | $12,000 | $44,448 |
| 2020 | $724 | $56,448 | $12,000 | $44,448 |
| 2019 | $691 | $52,760 | $10,400 | $42,360 |
| 2018 | $678 | $52,760 | $10,400 | $42,360 |
| 2017 | $1,411 | $47,278 | $10,400 | $36,878 |
| 2016 | $507 | $47,278 | $10,400 | $36,878 |
| 2015 | $506 | $47,278 | $10,400 | $36,878 |
| 2014 | $391 | $43,248 | $6,370 | $36,878 |
| 2013 | -- | $40,708 | $6,370 | $34,338 |
Source: Public Records
Map
Nearby Homes
- 5 Olevia St
- 326 Fayette Dr
- 0 Sims Rd Unit 10674254
- 615 Gainesville Hwy
- 58 Cedar Bluff
- 222 Ryan Rd
- 223 Lacey Ln
- 318 Ryan Rd
- 197 Buena Vista St
- 27 Creekside Dr
- 466 Pendergrass Rd
- 116 Wisteria Dr
- 154 Williamsburg Way
- 132 Wisteria Dr
- 136 Wisteria Dr
- 66 Wisteria Way
- 52 Wisteria Ct
- 303 Rocky Point Ct
- 475 Pendergrass Rd
- 326 Miles Patrick Rd
Your Personal Tour Guide
Ask me questions while you tour the home.