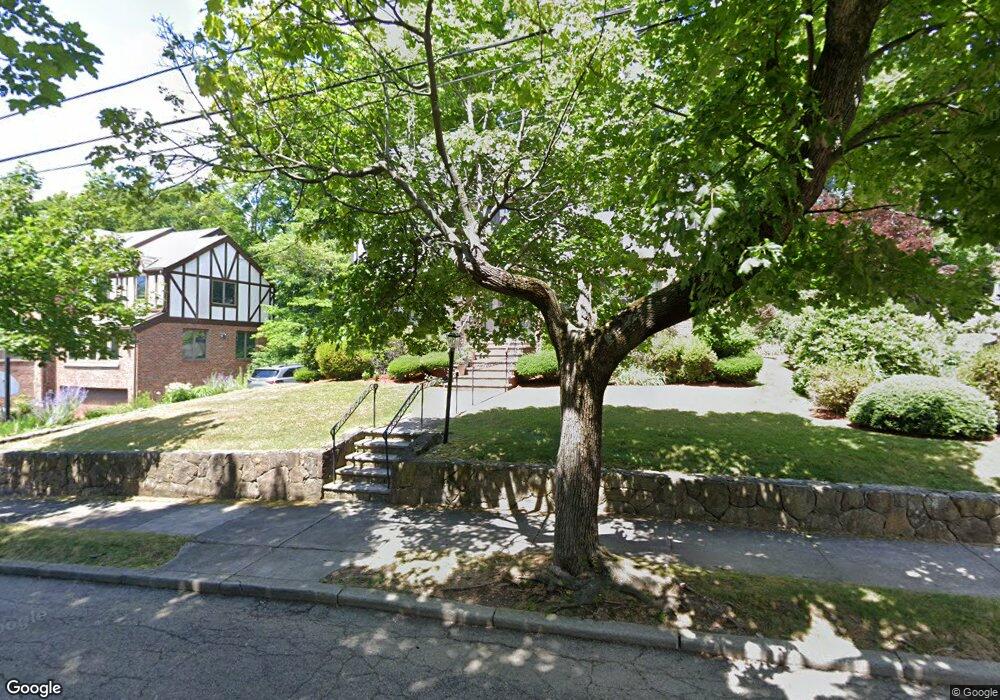
11 Lancaster Rd Newton, MA 02458
Newton Corner NeighborhoodEstimated Value: $2,217,714 - $2,621,000
4
Beds
3
Baths
3,485
Sq Ft
$699/Sq Ft
Est. Value
About This Home
This home is located at 11 Lancaster Rd, Newton, MA 02458 and is currently estimated at $2,437,429, approximately $699 per square foot. 11 Lancaster Rd is a home located in Middlesex County with nearby schools including Ward Elementary School, Bigelow Middle School, and Newton North High School.
Ownership History
Date
Name
Owned For
Owner Type
Purchase Details
Closed on
Mar 4, 2003
Sold by
Spsell Sheldon P and Spsell Paula D
Bought by
Mamon Harvey and Fern Roberta
Current Estimated Value
Home Financials for this Owner
Home Financials are based on the most recent Mortgage that was taken out on this home.
Original Mortgage
$650,000
Outstanding Balance
$281,473
Interest Rate
5.98%
Mortgage Type
Purchase Money Mortgage
Estimated Equity
$2,155,956
Create a Home Valuation Report for This Property
The Home Valuation Report is an in-depth analysis detailing your home's value as well as a comparison with similar homes in the area
Home Values in the Area
Average Home Value in this Area
Purchase History
| Date | Buyer | Sale Price | Title Company |
|---|---|---|---|
| Mamon Harvey | $1,035,000 | -- |
Source: Public Records
Mortgage History
| Date | Status | Borrower | Loan Amount |
|---|---|---|---|
| Open | Mamon Harvey | $650,000 |
Source: Public Records
Tax History Compared to Growth
Tax History
| Year | Tax Paid | Tax Assessment Tax Assessment Total Assessment is a certain percentage of the fair market value that is determined by local assessors to be the total taxable value of land and additions on the property. | Land | Improvement |
|---|---|---|---|---|
| 2025 | $19,900 | $2,030,600 | $1,352,200 | $678,400 |
| 2024 | $19,242 | $1,971,500 | $1,312,800 | $658,700 |
| 2023 | $18,449 | $1,812,300 | $1,005,200 | $807,100 |
| 2022 | $17,654 | $1,678,100 | $930,700 | $747,400 |
| 2021 | $17,034 | $1,583,100 | $878,000 | $705,100 |
| 2020 | $16,528 | $1,583,100 | $878,000 | $705,100 |
| 2019 | $16,062 | $1,537,000 | $852,400 | $684,600 |
| 2018 | $5,889 | $1,445,800 | $773,900 | $671,900 |
| 2017 | $15,168 | $1,364,000 | $730,100 | $633,900 |
| 2016 | $14,507 | $1,274,800 | $682,300 | $592,500 |
| 2015 | $13,832 | $1,191,400 | $637,700 | $553,700 |
Source: Public Records
Map
Nearby Homes
- 23 Francis St Unit 23-1
- 21 Francis St Unit 21A
- 44 Irving St
- 1004 Centre St
- 686 Centre St
- 59 Hyde Ave
- 35 George St Unit 35
- 37 George St Unit 37
- 642 Centre St
- 73 Elmore St
- 5 Merrill Rd
- 206 Franklin St
- 3 Cedar St
- 44 Blake St Unit 2
- 127-129 Withington Rd Unit 1
- 106 Farlow Rd
- 548 Centre St Unit 5
- 9 The Ledges Rd
- 14 Summit St
- 34 Morton Rd