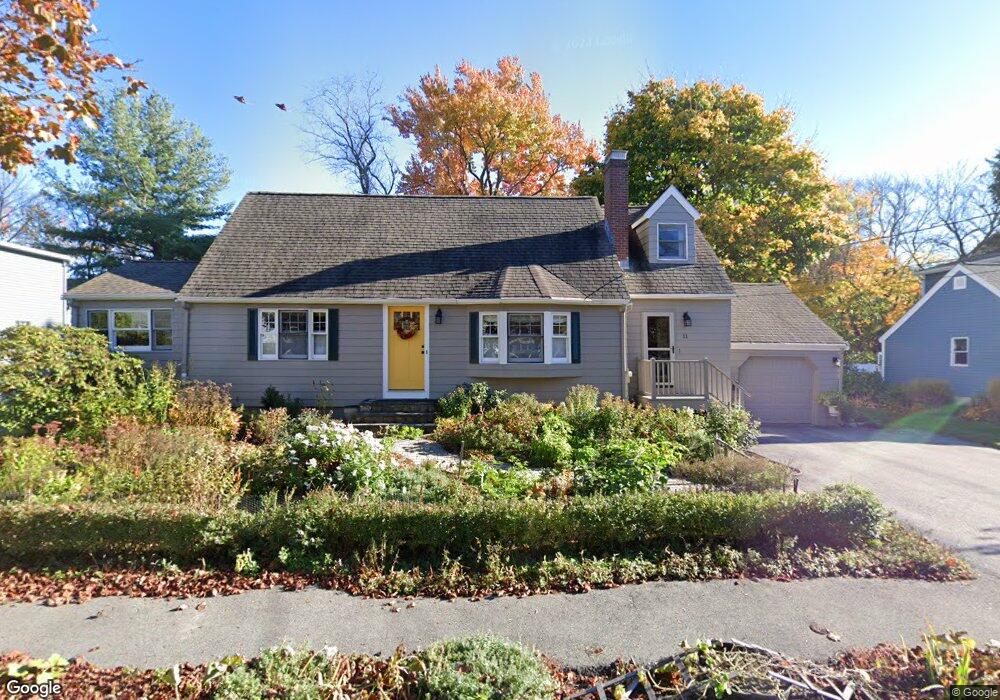
11 Linda Rd Wakefield, MA 01880
West Side NeighborhoodEstimated Value: $765,000 - $903,000
3
Beds
2
Baths
1,800
Sq Ft
$472/Sq Ft
Est. Value
About This Home
This home is located at 11 Linda Rd, Wakefield, MA 01880 and is currently estimated at $849,564, approximately $471 per square foot. 11 Linda Rd is a home located in Middlesex County with nearby schools including Wakefield Memorial High School and St Joseph School.
Ownership History
Date
Name
Owned For
Owner Type
Purchase Details
Closed on
Aug 1, 1996
Sold by
Bresten Paul and Bresten Theresa
Bought by
Haddad Joseph and Haddad Lynn
Current Estimated Value
Create a Home Valuation Report for This Property
The Home Valuation Report is an in-depth analysis detailing your home's value as well as a comparison with similar homes in the area
Home Values in the Area
Average Home Value in this Area
Purchase History
We collect this data history from publicly available records. To have your information removed, we recommend requesting removal directly through your county’s website.
| Date | Buyer | Sale Price | Title Company |
|---|---|---|---|
| Haddad Joseph | $205,500 | -- |
Source: Public Records
Mortgage History
We collect this data history from publicly available records. To have your information removed, we recommend requesting removal directly through your county’s website.
| Date | Status | Borrower | Loan Amount |
|---|---|---|---|
| Open | Haddad Joseph | $87,600 | |
| Open | Haddad Joseph | $156,700 |
Source: Public Records
Tax History
| Year | Tax Paid | Tax Assessment Tax Assessment Total Assessment is a certain percentage of the fair market value that is determined by local assessors to be the total taxable value of land and additions on the property. | Land | Improvement |
|---|---|---|---|---|
| 2025 | $8,938 | $787,500 | $395,500 | $392,000 |
| 2024 | $8,242 | $732,600 | $367,900 | $364,700 |
| 2023 | $8,022 | $683,900 | $343,400 | $340,500 |
| 2022 | $7,524 | $610,700 | $306,600 | $304,100 |
| 2021 | $7,204 | $565,900 | $280,300 | $285,600 |
| 2020 | $6,774 | $530,500 | $262,800 | $267,700 |
| 2019 | $6,355 | $495,300 | $245,300 | $250,000 |
| 2018 | $6,125 | $473,000 | $234,300 | $238,700 |
| 2017 | $5,761 | $442,100 | $219,000 | $223,100 |
| 2016 | $5,740 | $425,500 | $216,200 | $209,300 |
| 2015 | $5,361 | $397,700 | $202,000 | $195,700 |
| 2014 | $4,959 | $388,000 | $197,100 | $190,900 |
Source: Public Records
Map
Nearby Homes
- 22 Sweetser St
- 44 Church St
- 13 Parker Rd
- 20 Lawrence St Unit 2
- 284 Main St
- 3 Walnut St
- 1 Summit Dr Unit 24
- 1 Summit Dr Unit 57
- 13 Carnation Cir Unit B
- 6 Highland St
- 249 Salem St Unit 4
- 175 North Ave Unit 407
- 269 Main St Unit 4001
- 62 Foundry St Unit 312
- 62 Foundry St Unit 505
- 62 Foundry St Unit 202
- 295 Main St Unit 16
- 48 Village St Unit 1001
- 7 Ballister St Unit 428
- 190 Main St
Your Personal Tour Guide
Ask me questions while you tour the home.