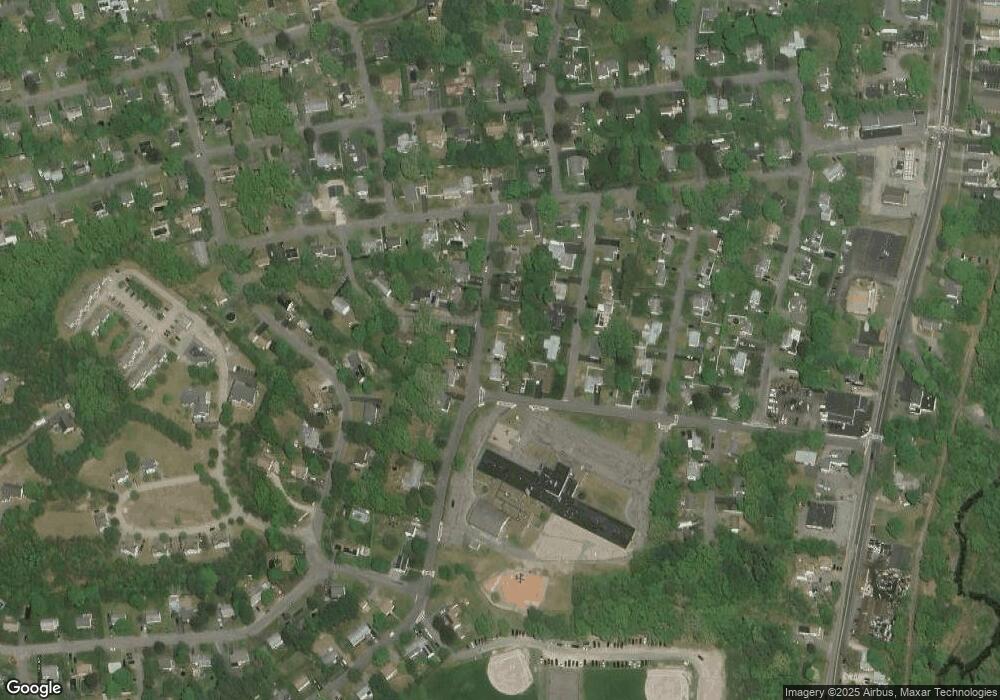
11 Locust St Oxford, MA 01540
Estimated Value: $314,000 - $440,000
3
Beds
1
Bath
912
Sq Ft
$397/Sq Ft
Est. Value
About This Home
This home is located at 11 Locust St, Oxford, MA 01540 and is currently estimated at $361,672, approximately $396 per square foot. 11 Locust St is a home located in Worcester County with nearby schools including Alfred M Chaffee, Oxford High School, and Clara Barton Elementary School.
Ownership History
Date
Name
Owned For
Owner Type
Purchase Details
Closed on
Aug 10, 2021
Sold by
Brunelle Thelma I Est
Bought by
Sprague Christopher
Current Estimated Value
Home Financials for this Owner
Home Financials are based on the most recent Mortgage that was taken out on this home.
Original Mortgage
$220,000
Outstanding Balance
$200,346
Interest Rate
3%
Mortgage Type
Purchase Money Mortgage
Estimated Equity
$161,326
Purchase Details
Closed on
Nov 23, 2015
Sold by
Brunelle Thelma I Est
Bought by
Starr Diane C and Starr Linda M
Purchase Details
Closed on
Dec 9, 1988
Sold by
Daniels Joseph
Bought by
Brunelle Arthur
Home Financials for this Owner
Home Financials are based on the most recent Mortgage that was taken out on this home.
Original Mortgage
$76,000
Interest Rate
10.17%
Mortgage Type
Purchase Money Mortgage
Create a Home Valuation Report for This Property
The Home Valuation Report is an in-depth analysis detailing your home's value as well as a comparison with similar homes in the area
Home Values in the Area
Average Home Value in this Area
Purchase History
| Date | Buyer | Sale Price | Title Company |
|---|---|---|---|
| Sprague Christopher | $220,000 | None Available | |
| Starr Diane C | -- | -- | |
| Brunelle Arthur | $95,000 | -- |
Source: Public Records
Mortgage History
| Date | Status | Borrower | Loan Amount |
|---|---|---|---|
| Open | Sprague Christopher | $220,000 | |
| Previous Owner | Brunelle Arthur | $76,000 |
Source: Public Records
Tax History Compared to Growth
Tax History
| Year | Tax Paid | Tax Assessment Tax Assessment Total Assessment is a certain percentage of the fair market value that is determined by local assessors to be the total taxable value of land and additions on the property. | Land | Improvement |
|---|---|---|---|---|
| 2025 | $40 | $315,400 | $85,000 | $230,400 |
| 2024 | $3,704 | $274,800 | $81,100 | $193,700 |
| 2023 | $3,699 | $271,200 | $77,500 | $193,700 |
| 2022 | $3,502 | $216,700 | $76,300 | $140,400 |
| 2021 | $3,265 | $197,500 | $72,400 | $125,100 |
| 2020 | $3,164 | $189,900 | $72,400 | $117,500 |
| 2019 | $2,929 | $172,000 | $72,400 | $99,600 |
| 2018 | $2,774 | $160,600 | $72,400 | $88,200 |
| 2017 | $2,715 | $161,100 | $69,400 | $91,700 |
| 2016 | $2,727 | $161,100 | $69,400 | $91,700 |
| 2015 | $2,544 | $161,100 | $69,400 | $91,700 |
| 2014 | $2,460 | $164,000 | $67,600 | $96,400 |
Source: Public Records
Map
Nearby Homes