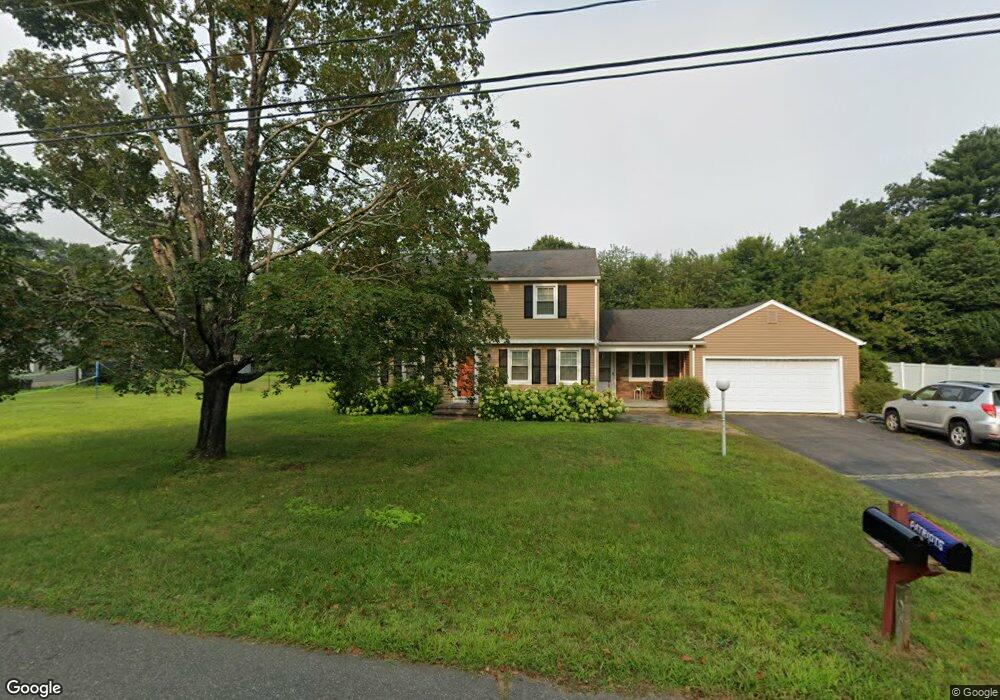
11 Longview Dr Wilbraham, MA 01095
Estimated Value: $452,572 - $546,000
4
Beds
2
Baths
1,895
Sq Ft
$264/Sq Ft
Est. Value
About This Home
This home is located at 11 Longview Dr, Wilbraham, MA 01095 and is currently estimated at $500,143, approximately $263 per square foot. 11 Longview Dr is a home located in Hampden County with nearby schools including Minnechaug Regional High School, Pioneer Valley Montessori School, and Wilbraham & Monson Academy.
Ownership History
Date
Name
Owned For
Owner Type
Purchase Details
Closed on
Sep 15, 2006
Sold by
Alarie Leon J
Bought by
Mendez Margarita
Current Estimated Value
Home Financials for this Owner
Home Financials are based on the most recent Mortgage that was taken out on this home.
Original Mortgage
$170,000
Outstanding Balance
$102,314
Interest Rate
6.71%
Mortgage Type
Purchase Money Mortgage
Estimated Equity
$397,829
Create a Home Valuation Report for This Property
The Home Valuation Report is an in-depth analysis detailing your home's value as well as a comparison with similar homes in the area
Home Values in the Area
Average Home Value in this Area
Purchase History
| Date | Buyer | Sale Price | Title Company |
|---|---|---|---|
| Mendez Margarita | $270,000 | -- |
Source: Public Records
Mortgage History
| Date | Status | Borrower | Loan Amount |
|---|---|---|---|
| Open | Mendez Margarita | $170,000 |
Source: Public Records
Tax History
| Year | Tax Paid | Tax Assessment Tax Assessment Total Assessment is a certain percentage of the fair market value that is determined by local assessors to be the total taxable value of land and additions on the property. | Land | Improvement |
|---|---|---|---|---|
| 2025 | $6,793 | $379,900 | $96,600 | $283,300 |
| 2024 | $6,838 | $369,600 | $96,600 | $273,000 |
| 2023 | $6,489 | $349,000 | $96,600 | $252,400 |
| 2022 | $6,489 | $316,700 | $96,600 | $220,100 |
| 2021 | $6,167 | $268,600 | $103,700 | $164,900 |
| 2020 | $6,011 | $268,600 | $103,700 | $164,900 |
| 2019 | $5,855 | $268,600 | $103,700 | $164,900 |
| 2018 | $5,861 | $258,900 | $103,700 | $155,200 |
| 2017 | $5,696 | $258,900 | $103,700 | $155,200 |
| 2016 | $5,348 | $247,600 | $115,300 | $132,300 |
| 2015 | $5,170 | $247,600 | $115,300 | $132,300 |
Source: Public Records
Map
Nearby Homes
- 6 Katie St
- 24 Mcintosh Dr
- 5 Northwood Dr
- 230V Burleigh Rd
- 208 Tamarack Dr
- 85 Baldwin Dr
- 25 Angelica Dr
- 107 Baldwin Dr
- 6 Brooklawn Rd
- 8 Patriot Ridge Ln
- 301 Tinkham Rd
- 16 Deerfoot Dr
- 15 Pine Acre Rd
- 46 Holland Dr
- 6 Hilltop Park
- 98 Fox Woods Dr
- 17 Jeanne Marie St
- 2306 Wilbraham Rd
- 60 Jeanne Marie St
- 228 Acrebrook Rd
Your Personal Tour Guide
Ask me questions while you tour the home.