Estimated Value: $223,000 - $418,000
2
Beds
1
Bath
896
Sq Ft
$347/Sq Ft
Est. Value
About This Home
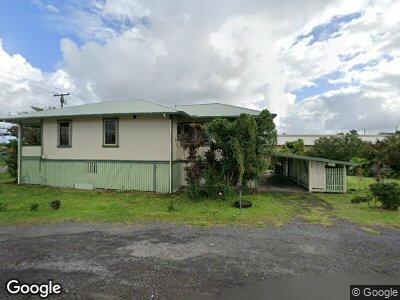
This home is located at 11 Lono St Unit 3948, Hilo, HI 96720 and is currently estimated at $310,523, approximately $346 per square foot. 11 Lono St Unit 3948 is a home located in Hawaii County with nearby schools including Mountain View Elementary School, Keaau Middle School, and Keaau High School.
Ownership History
Date
Name
Owned For
Owner Type
Purchase Details
Closed on
Feb 17, 2021
Sold by
Doreste Skyler Ian
Bought by
Regrutto Paul Randall and Regrutto Kristin Jo
Current Estimated Value
Purchase Details
Closed on
May 26, 2016
Sold by
Box Frank Erickson
Bought by
Doreste Skyler Ian
Home Financials for this Owner
Home Financials are based on the most recent Mortgage that was taken out on this home.
Original Mortgage
$122,735
Interest Rate
3.59%
Mortgage Type
FHA
Purchase Details
Closed on
Jan 25, 2013
Sold by
Lane Christopher Ward
Bought by
Box Frank Erickson
Purchase Details
Closed on
Feb 19, 2008
Sold by
Lane Jeanne Shincell
Bought by
Lane Christopher Ward
Purchase Details
Closed on
Sep 23, 2002
Sold by
Lane Christopher Ward
Bought by
Lane Christopher Ward and Lane Jeanne Shincell
Create a Home Valuation Report for This Property
The Home Valuation Report is an in-depth analysis detailing your home's value as well as a comparison with similar homes in the area
Home Values in the Area
Average Home Value in this Area
Purchase History
| Date | Buyer | Sale Price | Title Company |
|---|---|---|---|
| Regrutto Paul Randall | $215,000 | Tg | |
| Doreste Skyler Ian | $125,000 | Tg | |
| Box Frank Erickson | $90,000 | Fam | |
| Lane Christopher Ward | -- | None Available | |
| Lane Christopher Ward | -- | Security Title Corporation |
Source: Public Records
Mortgage History
| Date | Status | Borrower | Loan Amount |
|---|---|---|---|
| Previous Owner | Doreste Skyler Ian | $122,735 | |
| Previous Owner | Lane Christopher Ward | $30,299 | |
| Previous Owner | Lane Christopher Ward | $39,360 |
Source: Public Records
Tax History Compared to Growth
Tax History
| Year | Tax Paid | Tax Assessment Tax Assessment Total Assessment is a certain percentage of the fair market value that is determined by local assessors to be the total taxable value of land and additions on the property. | Land | Improvement |
|---|---|---|---|---|
| 2024 | $1,545 | $139,200 | $22,300 | $116,900 |
| 2023 | $1,454 | $131,000 | $22,300 | $108,700 |
| 2022 | $1,374 | $123,800 | $15,100 | $108,700 |
| 2021 | $1,130 | $101,800 | $11,500 | $90,300 |
| 2020 | $1,255 | $113,100 | $12,600 | $100,500 |
| 2019 | $1,284 | $115,700 | $12,900 | $102,800 |
| 2018 | $1,163 | $104,800 | $15,500 | $89,300 |
| 2017 | $1,073 | $96,700 | $9,500 | $87,200 |
| 2016 | $868 | $86,400 | $8,800 | $77,600 |
| 2015 | -- | $80,700 | $8,200 | $72,500 |
| 2014 | -- | $80,600 | $8,000 | $72,600 |
Source: Public Records
Map
Nearby Homes
- 113909 Liona St
- 0 5th St Unit 719213
- 11-3911 Liona St
- 11-3953 Liona St
- 113948 Liona St
- 11-3950 Liona St
- 11-3791 4th St
- 11-3817 Liona St
- 11-3825 Liona St
- 0 Nahelenani St Unit 720741
- 0 Nahelenani St Unit 717911
- 0 Nahelenani St Unit 717910
- 0 Nahelenani St Unit 715257
- 0 Nahelenani St Unit 710613
- 0 Nahelenani St Unit 710573
- 0 Nahelenani St Unit 702078
- 11 2nd St
- 11-3969-A Liona St
- 11-3944 Nahelenani St
- 113955 Nahelenani St
- 11 Lono St Unit 3928A
- 11 Lono St Unit 3925A
- 11 Lono St Unit 3910A
- 11 Lono St Unit 3974A
- 11 Lono St Unit 3942
- 11 Lono St Unit 3940
- 11 Lono St Unit 3942A
- 11 Lono St Unit 3948
- 11 Lono St Unit 3950
- 11 Lono St Unit 3956A
- 11 Lono St Unit 3968
- 11 Lono St Unit 3974
- 11 Lono St Unit 3978
- 11 Lono St Unit 3982
- 11 Lono St Unit 3985
- 11 Lono St Unit 3983
- 11 Lono St Unit 3975A
- 11 Lono St Unit 3969A
- 11 Lono St Unit 3953A
- 11 Lono St Unit 3939A