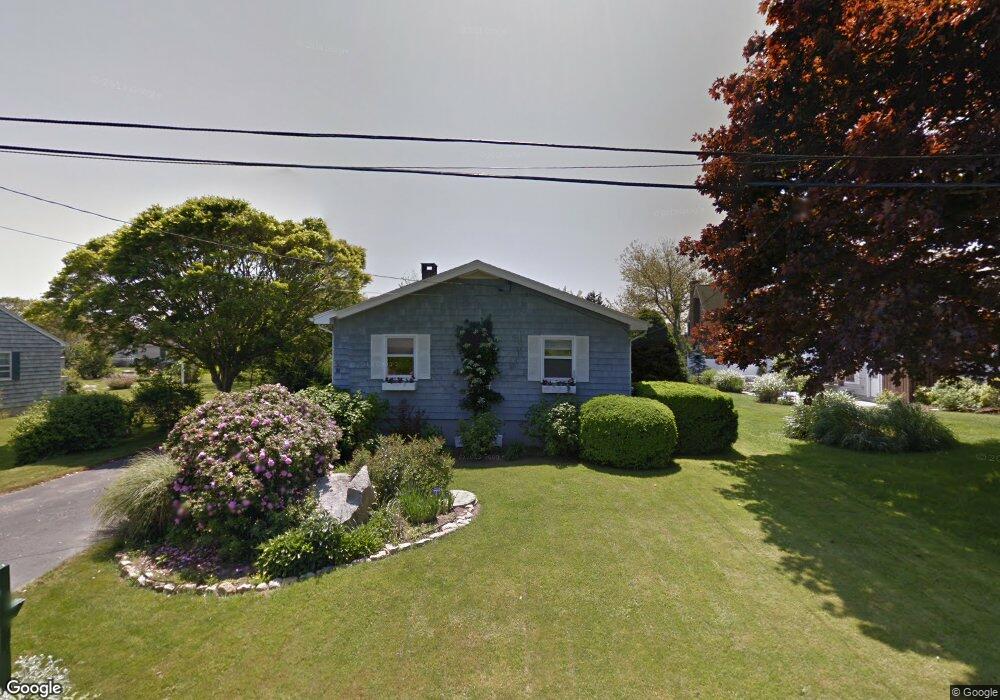
11 Lucas Ave Charlestown, RI 02813
Estimated Value: $1,547,000 - $2,035,000
3
Beds
2
Baths
1,504
Sq Ft
$1,139/Sq Ft
Est. Value
About This Home
This home is located at 11 Lucas Ave, Charlestown, RI 02813 and is currently estimated at $1,712,623, approximately $1,138 per square foot. 11 Lucas Ave is a home located in Washington County with nearby schools including Chariho Regional Middle School and Chariho High School.
Ownership History
Date
Name
Owned For
Owner Type
Purchase Details
Closed on
Apr 13, 2015
Sold by
Blair James F and Blair Elaine F
Bought by
11 Lucas Ave Llc
Current Estimated Value
Purchase Details
Closed on
Mar 28, 1997
Sold by
Knebel George M
Bought by
Blair James F and Blair Elaine
Home Financials for this Owner
Home Financials are based on the most recent Mortgage that was taken out on this home.
Original Mortgage
$214,600
Interest Rate
7.59%
Create a Home Valuation Report for This Property
The Home Valuation Report is an in-depth analysis detailing your home's value as well as a comparison with similar homes in the area
Home Values in the Area
Average Home Value in this Area
Purchase History
| Date | Buyer | Sale Price | Title Company |
|---|---|---|---|
| 11 Lucas Ave Llc | -- | -- | |
| Blair James F | $137,500 | -- | |
| Blair James F | $137,500 | -- |
Source: Public Records
Mortgage History
| Date | Status | Borrower | Loan Amount |
|---|---|---|---|
| Previous Owner | Blair James F | $214,600 |
Source: Public Records
Tax History Compared to Growth
Tax History
| Year | Tax Paid | Tax Assessment Tax Assessment Total Assessment is a certain percentage of the fair market value that is determined by local assessors to be the total taxable value of land and additions on the property. | Land | Improvement |
|---|---|---|---|---|
| 2025 | $8,470 | $1,428,400 | $1,177,900 | $250,500 |
| 2024 | $8,256 | $1,428,400 | $1,177,900 | $250,500 |
| 2023 | $8,199 | $1,428,400 | $1,177,900 | $250,500 |
| 2022 | $7,635 | $934,500 | $734,500 | $200,000 |
| 2021 | $7,642 | $934,200 | $734,500 | $199,700 |
| 2020 | $7,688 | $934,200 | $734,500 | $199,700 |
| 2019 | $7,661 | $830,000 | $690,000 | $140,000 |
| 2018 | $8,001 | $830,000 | $690,000 | $140,000 |
| 2017 | $7,960 | $830,000 | $690,000 | $140,000 |
| 2016 | $7,281 | $713,100 | $566,600 | $146,500 |
| 2015 | $7,209 | $713,100 | $566,600 | $146,500 |
| 2014 | $7,060 | $713,100 | $566,600 | $146,500 |
Source: Public Records
Map
Nearby Homes