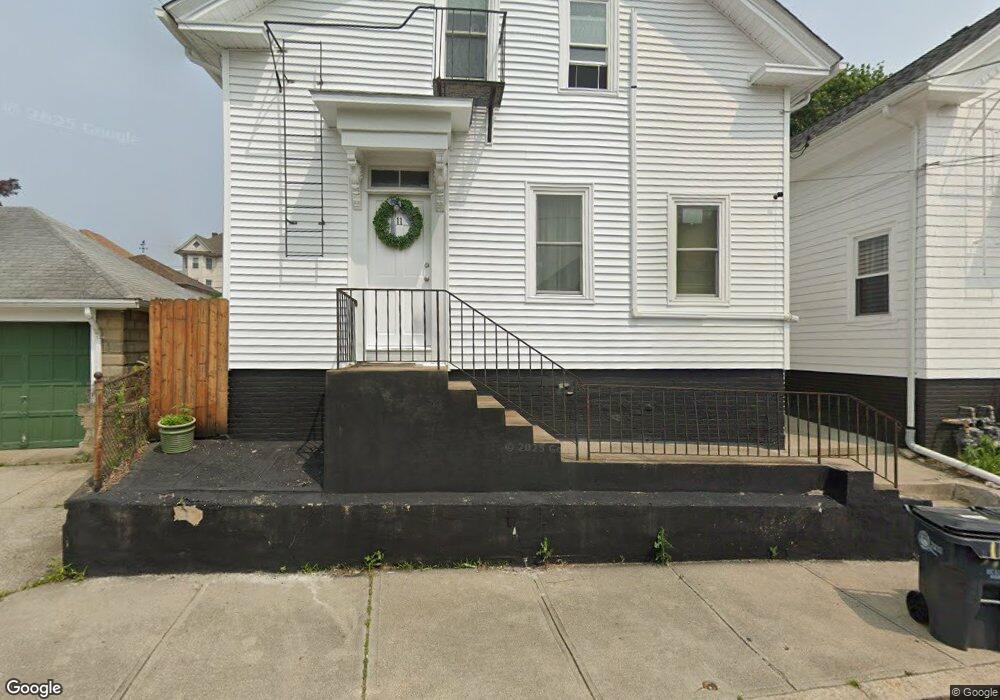
11 Lynch St Providence, RI 02908
Mount Pleasant NeighborhoodEstimated Value: $363,326 - $494,000
4
Beds
2
Baths
1,238
Sq Ft
$355/Sq Ft
Est. Value
About This Home
This home is located at 11 Lynch St, Providence, RI 02908 and is currently estimated at $439,582, approximately $355 per square foot. 11 Lynch St is a home located in Providence County with nearby schools including Paul Cuffee Middle School, Blessed Sacrament School, and Mount Pleasant Academy.
Ownership History
Date
Name
Owned For
Owner Type
Purchase Details
Closed on
May 15, 2024
Sold by
Quinche Francisco M and Quinche Gabriela C
Bought by
Quinche Francisco M and Quinche Gabriela C
Current Estimated Value
Purchase Details
Closed on
Jan 26, 2024
Sold by
Quinde Fransico M and Torres-Morris Sandra F
Bought by
Quinche Francisco M and Quinche Gabriela C
Purchase Details
Closed on
Mar 24, 2022
Sold by
Quinde Francisco M
Bought by
Quinde Francisco M and Torres-Morris Sandra P
Purchase Details
Closed on
Dec 20, 2021
Sold by
Morris Raymond L and Morris Yvette A
Bought by
Quinde Francisco M
Create a Home Valuation Report for This Property
The Home Valuation Report is an in-depth analysis detailing your home's value as well as a comparison with similar homes in the area
Home Values in the Area
Average Home Value in this Area
Purchase History
| Date | Buyer | Sale Price | Title Company |
|---|---|---|---|
| Quinche Francisco M | -- | None Available | |
| Quinche Francisco M | -- | None Available | |
| Quinche Francisco M | -- | None Available | |
| Quinche Francisco M | -- | None Available | |
| Quinde Francisco M | -- | None Available | |
| Quinde Francisco M | -- | None Available | |
| Quinde Francisco M | -- | None Available | |
| Quinde Francisco M | $130,000 | None Available | |
| Quinde Francisco M | $130,000 | None Available | |
| Quinde Francisco M | $130,000 | None Available |
Source: Public Records
Tax History
| Year | Tax Paid | Tax Assessment Tax Assessment Total Assessment is a certain percentage of the fair market value that is determined by local assessors to be the total taxable value of land and additions on the property. | Land | Improvement |
|---|---|---|---|---|
| 2025 | $2,613 | $346,100 | $126,600 | $219,500 |
| 2024 | $4,221 | $230,000 | $73,200 | $156,800 |
| 2023 | $4,221 | $230,000 | $73,200 | $156,800 |
| 2022 | $4,094 | $230,000 | $73,200 | $156,800 |
| 2021 | $3,215 | $130,900 | $51,200 | $79,700 |
| 2020 | $3,215 | $130,900 | $51,200 | $79,700 |
| 2019 | $3,215 | $130,900 | $51,200 | $79,700 |
| 2018 | $2,697 | $84,400 | $32,900 | $51,500 |
| 2017 | $2,697 | $84,400 | $32,900 | $51,500 |
| 2016 | $2,697 | $84,400 | $32,900 | $51,500 |
| 2015 | $2,410 | $72,800 | $30,100 | $42,700 |
| 2014 | $2,457 | $72,800 | $30,100 | $42,700 |
| 2013 | $2,457 | $72,800 | $30,100 | $42,700 |
Source: Public Records
Map
Nearby Homes
Your Personal Tour Guide
Ask me questions while you tour the home.