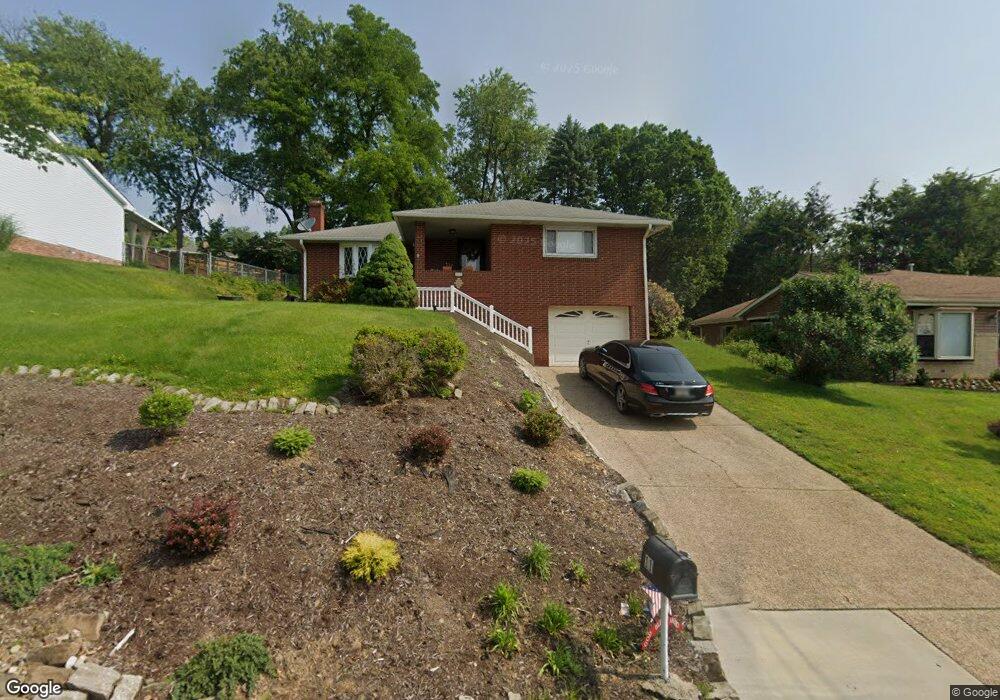
11 Lynmar Rd Pittsburgh, PA 15209
Shaler Township NeighborhoodEstimated Value: $268,000 - $309,000
3
Beds
2
Baths
1,236
Sq Ft
$236/Sq Ft
Est. Value
About This Home
This home is located at 11 Lynmar Rd, Pittsburgh, PA 15209 and is currently estimated at $292,147, approximately $236 per square foot. 11 Lynmar Rd is a home located in Allegheny County with nearby schools including Shaler Area Elementary School, Scott Primary School, and Shaler Area Middle School.
Ownership History
Date
Name
Owned For
Owner Type
Purchase Details
Closed on
Nov 2, 2023
Sold by
Pawlak Joseph R By Aif
Bought by
Waters James and Waters Tiffany
Current Estimated Value
Home Financials for this Owner
Home Financials are based on the most recent Mortgage that was taken out on this home.
Original Mortgage
$174,000
Outstanding Balance
$170,780
Interest Rate
7.19%
Mortgage Type
New Conventional
Estimated Equity
$121,367
Purchase Details
Closed on
Oct 27, 2023
Sold by
Pawlak Joseph R
Bought by
Waters James and Waters Tiffany
Home Financials for this Owner
Home Financials are based on the most recent Mortgage that was taken out on this home.
Original Mortgage
$174,000
Outstanding Balance
$170,780
Interest Rate
7.19%
Mortgage Type
New Conventional
Estimated Equity
$121,367
Purchase Details
Closed on
Sep 8, 2016
Sold by
Catherine M Pawlak Revocable Living Trus
Bought by
Pawlak Joseph R
Create a Home Valuation Report for This Property
The Home Valuation Report is an in-depth analysis detailing your home's value as well as a comparison with similar homes in the area
Home Values in the Area
Average Home Value in this Area
Purchase History
| Date | Buyer | Sale Price | Title Company |
|---|---|---|---|
| Waters James | $244,000 | -- | |
| Waters James | $244,000 | -- | |
| Waters James | $244,000 | -- | |
| Pawlak Joseph R | -- | None Available |
Source: Public Records
Mortgage History
| Date | Status | Borrower | Loan Amount |
|---|---|---|---|
| Open | Waters James | $174,000 | |
| Closed | Waters James | $174,000 |
Source: Public Records
Tax History Compared to Growth
Tax History
| Year | Tax Paid | Tax Assessment Tax Assessment Total Assessment is a certain percentage of the fair market value that is determined by local assessors to be the total taxable value of land and additions on the property. | Land | Improvement |
|---|---|---|---|---|
| 2025 | $4,449 | $135,100 | $45,200 | $89,900 |
| 2024 | $4,449 | $135,100 | $45,200 | $89,900 |
| 2023 | $4,290 | $135,100 | $45,200 | $89,900 |
| 2022 | $4,290 | $135,100 | $45,200 | $89,900 |
| 2021 | $4,289 | $135,100 | $45,200 | $89,900 |
| 2020 | $4,290 | $135,100 | $45,200 | $89,900 |
| 2019 | $4,155 | $135,100 | $45,200 | $89,900 |
| 2018 | $639 | $135,100 | $45,200 | $89,900 |
| 2017 | $4,023 | $135,100 | $45,200 | $89,900 |
| 2016 | $639 | $135,100 | $45,200 | $89,900 |
| 2015 | $639 | $135,100 | $45,200 | $89,900 |
| 2014 | $3,858 | $135,100 | $45,200 | $89,900 |
Source: Public Records
Map
Nearby Homes
- 133 Sunset Ln
- 530 Glenhaven Dr
- 1826 President Dr
- 102 Forliview Rd
- 104 Sunnyhill Dr
- 105 Forliview Rd
- 130 Gerard Dr
- 208 Andrew Dr
- 335 Woodbridge Dr
- 308 Sandy Dr
- 238 Woodbridge Dr
- 113 Mcginley Dr
- 631 Maplewood Ct
- 356 Goldsmith Rd
- 408 Bryn Ct
- 101 Sunset Dr
- 447 Englewood Dr
- 2501 Oakwood Rd
- 768 Venango Ave
- 770 Venango Ave