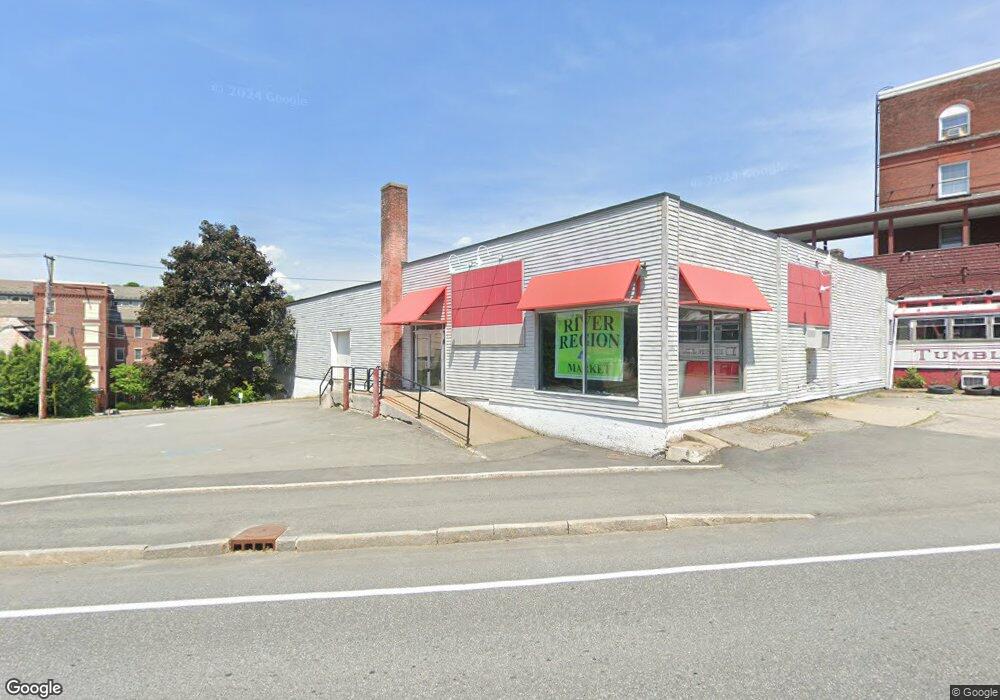
11 Main St Claremont, NH 03743
Estimated Value: $322,009
--
Bed
--
Bath
5,353
Sq Ft
$60/Sq Ft
Est. Value
About This Home
This home is located at 11 Main St, Claremont, NH 03743 and is currently priced at $322,009, approximately $60 per square foot. 11 Main St is a home located in Sullivan County with nearby schools including Bluff School, Claremont Middle School, and Stevens High School.
Ownership History
Date
Name
Owned For
Owner Type
Purchase Details
Closed on
Jun 18, 2025
Sold by
Mcintire Tanya D
Bought by
Smrkone Llc
Current Estimated Value
Home Financials for this Owner
Home Financials are based on the most recent Mortgage that was taken out on this home.
Original Mortgage
$268,000
Outstanding Balance
$266,836
Interest Rate
6.76%
Mortgage Type
Commercial
Purchase Details
Closed on
Feb 6, 1985
Bought by
Bond Auto Parts Inc
Create a Home Valuation Report for This Property
The Home Valuation Report is an in-depth analysis detailing your home's value as well as a comparison with similar homes in the area
Home Values in the Area
Average Home Value in this Area
Purchase History
| Date | Buyer | Sale Price | Title Company |
|---|---|---|---|
| Smrkone Llc | $225,000 | None Available | |
| Smrkone Llc | $225,000 | None Available | |
| Smrkone Llc | $225,000 | None Available | |
| Bond Auto Parts Inc | -- | -- |
Source: Public Records
Mortgage History
| Date | Status | Borrower | Loan Amount |
|---|---|---|---|
| Open | Smrkone Llc | $268,000 | |
| Closed | Smrkone Llc | $268,000 |
Source: Public Records
Tax History Compared to Growth
Tax History
| Year | Tax Paid | Tax Assessment Tax Assessment Total Assessment is a certain percentage of the fair market value that is determined by local assessors to be the total taxable value of land and additions on the property. | Land | Improvement |
|---|---|---|---|---|
| 2024 | $6,575 | $224,700 | $55,500 | $169,200 |
| 2023 | $6,247 | $224,700 | $55,500 | $169,200 |
| 2022 | $6,777 | $162,600 | $37,600 | $125,000 |
| 2021 | $8,729 | $213,000 | $37,600 | $175,400 |
| 2020 | $8,673 | $213,000 | $37,600 | $175,400 |
| 2019 | $8,575 | $213,000 | $37,600 | $175,400 |
| 2018 | $9,047 | $215,000 | $37,600 | $177,400 |
| 2017 | $9,172 | $215,000 | $37,600 | $177,400 |
| 2016 | $9,163 | $215,000 | $37,600 | $177,400 |
| 2015 | $8,916 | $215,000 | $37,600 | $177,400 |
| 2014 | $8,886 | $215,000 | $37,600 | $177,400 |
| 2013 | $10,074 | $277,900 | $41,400 | $236,500 |
Source: Public Records
Map
Nearby Homes
- 30 Crescent St
- 10 Crescent St
- 24 Crescent St
- 14 Main St
- 35 Crescent St
- 45 Crescent St
- 28 Main St
- 2 Main St
- 19 Sullivan St
- 19 Sullivan St
- 16-34 Opera House Square
- 16 Opera House Square
- 30 Opera House Square
- 6 Sullivan St
- 36-38 Opera House Square
- 27 Sullivan St
- 42 Opera House Square
- 40 Main St
- 42 Opera House Square
- 13 Water St