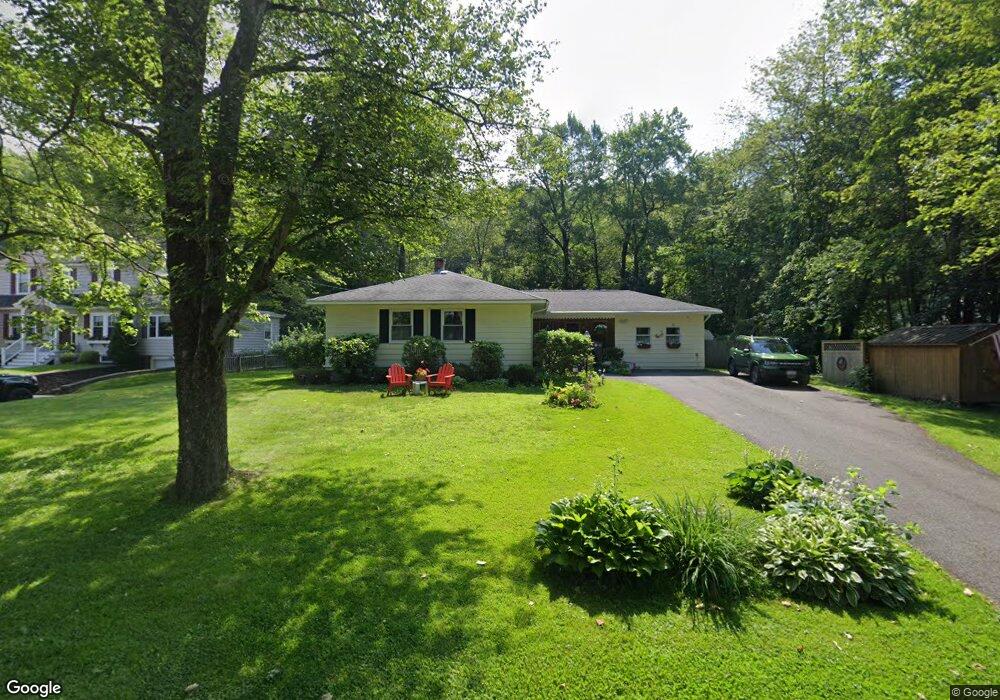
11 Maple Ln Greenfield, MA 01301
Estimated Value: $390,034 - $472,000
3
Beds
2
Baths
1,867
Sq Ft
$221/Sq Ft
Est. Value
About This Home
This home is located at 11 Maple Ln, Greenfield, MA 01301 and is currently estimated at $411,759, approximately $220 per square foot. 11 Maple Ln is a home located in Franklin County with nearby schools including Holy Trinity School and Cornerstone Christian School.
Ownership History
Date
Name
Owned For
Owner Type
Purchase Details
Closed on
Aug 30, 2022
Sold by
Miner Wendy
Bought by
Miner Wendy and Miner Ross
Current Estimated Value
Purchase Details
Closed on
Oct 5, 2011
Sold by
Mayrand Dolores A
Bought by
Braman Dolores A and Miner Wendy
Purchase Details
Closed on
May 14, 1992
Sold by
Knapp H Kendall
Bought by
Mayrand Wilfred E and Mayrand Dolores A
Home Financials for this Owner
Home Financials are based on the most recent Mortgage that was taken out on this home.
Original Mortgage
$76,000
Interest Rate
8.89%
Mortgage Type
Purchase Money Mortgage
Create a Home Valuation Report for This Property
The Home Valuation Report is an in-depth analysis detailing your home's value as well as a comparison with similar homes in the area
Home Values in the Area
Average Home Value in this Area
Purchase History
| Date | Buyer | Sale Price | Title Company |
|---|---|---|---|
| Miner Wendy | -- | None Available | |
| Braman Dolores A | -- | -- | |
| Mayrand Wilfred E | $116,666 | -- | |
| Mayrand Wilfred E | $116,666 | -- | |
| Mayrand Wilfred E | $116,666 | -- |
Source: Public Records
Mortgage History
| Date | Status | Borrower | Loan Amount |
|---|---|---|---|
| Previous Owner | Mayrand Wilfred E | $25,000 | |
| Previous Owner | Mayrand Wilfred E | $44,000 | |
| Previous Owner | Mayrand Wilfred E | $75,400 | |
| Previous Owner | Mayrand Wilfred E | $76,000 |
Source: Public Records
Tax History
| Year | Tax Paid | Tax Assessment Tax Assessment Total Assessment is a certain percentage of the fair market value that is determined by local assessors to be the total taxable value of land and additions on the property. | Land | Improvement |
|---|---|---|---|---|
| 2025 | $6,179 | $315,900 | $74,000 | $241,900 |
| 2024 | $6,207 | $304,400 | $61,000 | $243,400 |
| 2023 | $5,602 | $285,100 | $61,000 | $224,100 |
| 2022 | $5,504 | $246,600 | $58,100 | $188,500 |
| 2021 | $5,364 | $231,000 | $58,100 | $172,900 |
| 2020 | $4,957 | $216,200 | $58,100 | $158,100 |
| 2019 | $4,224 | $188,900 | $50,500 | $138,400 |
| 2018 | $4,188 | $186,700 | $49,400 | $137,300 |
| 2017 | $4,057 | $186,700 | $49,400 | $137,300 |
| 2016 | $4,063 | $186,300 | $52,300 | $134,000 |
| 2015 | $4,092 | $181,800 | $52,300 | $129,500 |
| 2014 | $3,743 | $182,300 | $52,300 | $130,000 |
Source: Public Records
Map
Nearby Homes
Your Personal Tour Guide
Ask me questions while you tour the home.