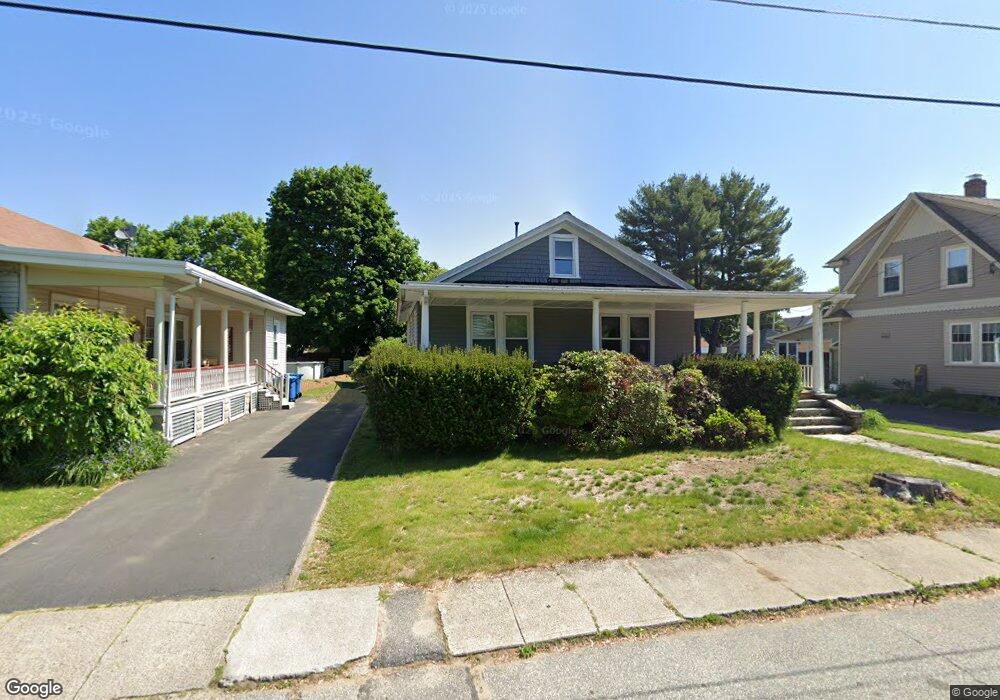
11 Marion St Uxbridge, MA 01569
Estimated Value: $401,321 - $472,000
2
Beds
1
Bath
1,168
Sq Ft
$380/Sq Ft
Est. Value
About This Home
This home is located at 11 Marion St, Uxbridge, MA 01569 and is currently estimated at $443,580, approximately $379 per square foot. 11 Marion St is a home located in Worcester County with nearby schools including Uxbridge High School, Our Lady of the Valley Regional School, and Whitinsville Christian School.
Ownership History
Date
Name
Owned For
Owner Type
Purchase Details
Closed on
Jun 18, 2019
Sold by
Duprey Ellen M
Bought by
Ellen M Duprey Ft 2019
Current Estimated Value
Purchase Details
Closed on
May 31, 1996
Sold by
Lydon Michael and Lydon Constance
Bought by
Duprey Ellen M
Create a Home Valuation Report for This Property
The Home Valuation Report is an in-depth analysis detailing your home's value as well as a comparison with similar homes in the area
Home Values in the Area
Average Home Value in this Area
Purchase History
| Date | Buyer | Sale Price | Title Company |
|---|---|---|---|
| Ellen M Duprey Ft 2019 | -- | -- | |
| Duprey Ellen M | $108,500 | -- |
Source: Public Records
Mortgage History
| Date | Status | Borrower | Loan Amount |
|---|---|---|---|
| Previous Owner | Duprey Ellen M | $121,000 | |
| Previous Owner | Duprey Ellen M | $18,000 | |
| Previous Owner | Duprey Ellen M | $10,000 |
Source: Public Records
Tax History Compared to Growth
Tax History
| Year | Tax Paid | Tax Assessment Tax Assessment Total Assessment is a certain percentage of the fair market value that is determined by local assessors to be the total taxable value of land and additions on the property. | Land | Improvement |
|---|---|---|---|---|
| 2025 | $39 | $298,400 | $128,300 | $170,100 |
| 2024 | $3,717 | $287,700 | $117,600 | $170,100 |
| 2023 | $3,670 | $263,100 | $106,900 | $156,200 |
| 2022 | $3,552 | $234,300 | $96,900 | $137,400 |
| 2021 | $3,639 | $230,000 | $92,600 | $137,400 |
| 2020 | $3,894 | $232,600 | $96,200 | $136,400 |
| 2019 | $3,739 | $215,500 | $89,100 | $126,400 |
| 2018 | $3,386 | $197,200 | $89,100 | $108,100 |
| 2017 | $3,809 | $224,600 | $76,900 | $147,700 |
| 2016 | $3,936 | $224,000 | $68,500 | $155,500 |
| 2015 | $3,852 | $221,400 | $68,500 | $152,900 |
Source: Public Records
Map
Nearby Homes
- 48 Homeward Ave
- 72 Homeward Ave
- 36 Elm St
- 307 N Main St
- 24 Road Ahr
- 24 Olde Canal Way Unit 24
- 20 Nature View Dr Unit 20
- 3 Strathmore Shire Unit A
- 128 Mantell Rd
- Layla Plan at Pine Ridge
- Ashley Plan at Pine Ridge
- Lily Plan at Pine Ridge
- Brooklyn Plan at Pine Ridge
- Tucker Plan at Pine Ridge
- Everleigh Plan at Pine Ridge
- 100 Spring Hill Dr Unit 100
- 288 High St
- 129 Elm St Unit Lot 7
- 7 Jefferson Ct Unit 7
- 60 Tyler Dr