
Seller's Agent in 2023
Victor Moore
The Landings Real Estate Co
(912) 656-7914
Estimated Value: $1,010,000 - $1,160,538
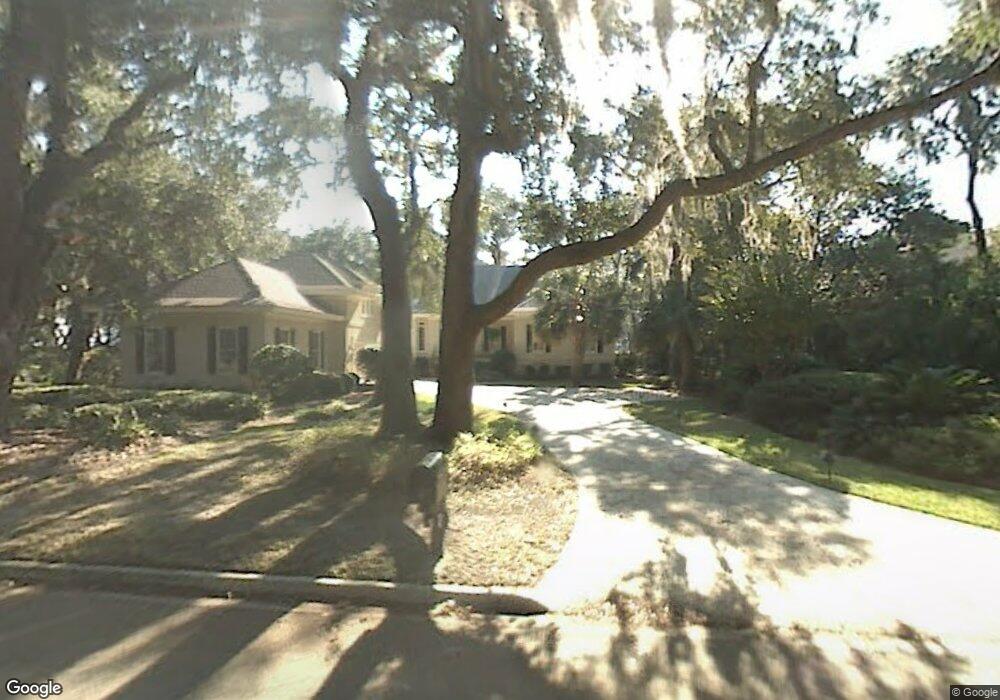
Incredible panoramic views of the Eastern marsh, saltwater lagoon and Marshwood #12! Located just steps from the marsh tower and convenient to the new Marshwood Clubhouse. Bright and airy, desirable one-level living is easy in this immaculately maintained home. Large bonus room with bath above the 2 car plus cart garage, AND a nearly 400 SF, newly renovated and climate-controlled flex space on the garage level, not included in the home’s measured square footage. Beautiful hardwood floors, new paint, 2 new hot water heaters, a new dishwasher, hardcoat stucco exterior and fully encapsulated crawl space add to the home’s appeal and low maintenance living. Driveway pavers were recently re-leveled and homeowners added a paver golf cart path leading to the separate garage cart entrance. A kitchen grilling deck and a rear deck with stunning vistas will surely have you enjoying the great outdoors. Landings living at its finest!
| Date | Buyer | Sale Price | Title Company |
|---|---|---|---|
| Levy Neal S | $974,700 | -- | |
| Wooleyhan Alfred M | $700,000 | -- | |
| Powley Bruce C | -- | -- |
| Date | Event | Price | List to Sale | Price per Sq Ft | Prior Sale |
|---|---|---|---|---|---|
| 04/03/2023 04/03/23 | Sold | $974,700 | +2.6% | $268 / Sq Ft | View Prior Sale |
| 02/12/2023 02/12/23 | Pending | -- | -- | -- | |
| 02/09/2023 02/09/23 | For Sale | $950,000 | +35.7% | $262 / Sq Ft | |
| 11/20/2020 11/20/20 | Sold | $700,000 | -4.0% | $193 / Sq Ft | View Prior Sale |
| 10/17/2020 10/17/20 | Pending | -- | -- | -- | |
| 09/13/2020 09/13/20 | Price Changed | $729,000 | -0.5% | $201 / Sq Ft | |
| 08/20/2020 08/20/20 | Price Changed | $732,900 | -2.1% | $202 / Sq Ft | |
| 05/18/2020 05/18/20 | For Sale | $749,000 | -- | $206 / Sq Ft |
| Year | Tax Paid | Tax Assessment Tax Assessment Total Assessment is a certain percentage of the fair market value that is determined by local assessors to be the total taxable value of land and additions on the property. | Land | Improvement |
|---|---|---|---|---|
| 2025 | $12,429 | $375,080 | $189,440 | $185,640 |
| 2024 | $12,429 | $389,880 | $189,440 | $200,440 |
| 2023 | $9,209 | $409,320 | $220,000 | $189,320 |
| 2022 | $9,976 | $326,480 | $123,200 | $203,280 |
| 2021 | $13,723 | $280,000 | $120,520 | $159,480 |
| 2020 | $2,666 | $288,880 | $123,200 | $165,680 |
| 2019 | $2,750 | $288,880 | $123,200 | $165,680 |
| 2018 | $2,601 | $284,720 | $123,200 | $161,520 |
| 2017 | $2,525 | $286,080 | $123,200 | $162,880 |
| 2016 | $2,567 | $275,840 | $123,200 | $152,640 |
| 2015 | $2,567 | $247,200 | $112,000 | $135,200 |
| 2014 | $3,857 | $255,360 | $0 | $0 |
Seller's Agent in 2023
Victor Moore
The Landings Real Estate Co
(912) 656-7914
Seller Co-Listing Agent in 2023
Christy Moore
The Landings Real Estate Co
(336) 263-5615
Buyer's Agent in 2023
George Jorgenson
The Landings Real Estate Co
(912) 220-9580
Seller's Agent in 2020
Peggy Utley
The Landings Real Estate Co
(912) 484-0500