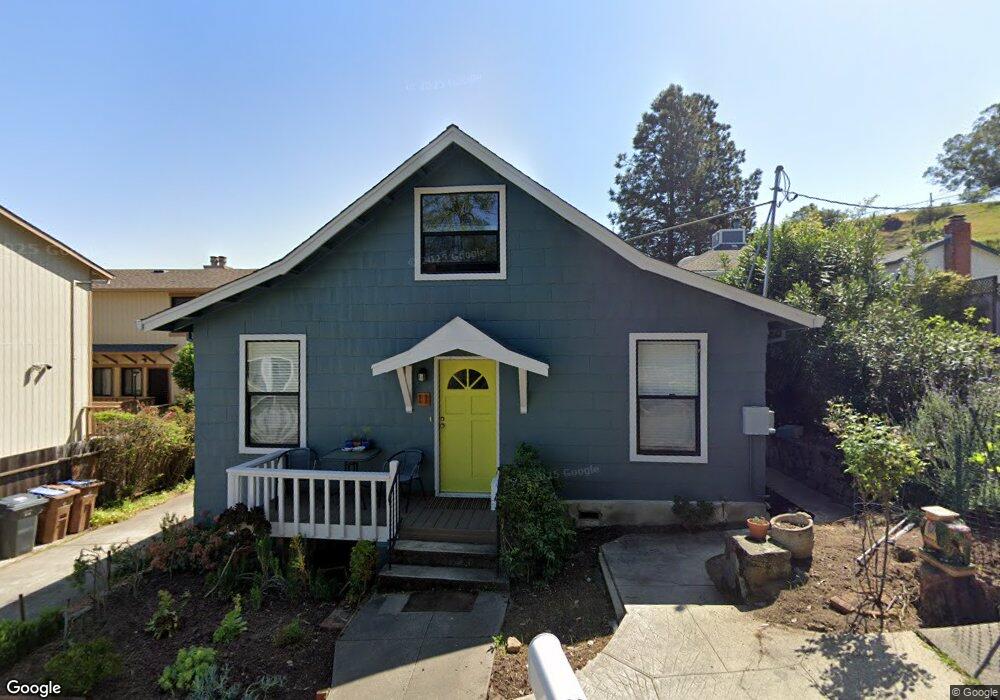
11 Martens Blvd Unit & 11A San Rafael, CA 94901
Picnic Valley NeighborhoodEstimated Value: $1,171,000 - $1,347,467
4
Beds
2
Baths
1,400
Sq Ft
$908/Sq Ft
Est. Value
About This Home
This home is located at 11 Martens Blvd Unit & 11A, San Rafael, CA 94901 and is currently estimated at $1,270,867, approximately $907 per square foot. 11 Martens Blvd Unit & 11A is a home located in Marin County with nearby schools including Laurel Dell Elementary School, James B. Davidson Middle School, and San Rafael High School.
Ownership History
Date
Name
Owned For
Owner Type
Purchase Details
Closed on
Jul 25, 2025
Sold by
Kfouri Emile
Bought by
Emile Kfouri Living Trust and Kfouri
Current Estimated Value
Purchase Details
Closed on
Jan 22, 2016
Sold by
Dunphy William F and Estate Of Charles E Smith
Bought by
Kfouri Emile
Home Financials for this Owner
Home Financials are based on the most recent Mortgage that was taken out on this home.
Original Mortgage
$696,500
Interest Rate
3.94%
Mortgage Type
New Conventional
Create a Home Valuation Report for This Property
The Home Valuation Report is an in-depth analysis detailing your home's value as well as a comparison with similar homes in the area
Home Values in the Area
Average Home Value in this Area
Purchase History
| Date | Buyer | Sale Price | Title Company |
|---|---|---|---|
| Emile Kfouri Living Trust | -- | None Listed On Document | |
| Emile Kfouri Living Trust | -- | None Listed On Document | |
| Kfouri Emile | $995,000 | Old Republic Title Company | |
| Kfouri Emile | $995,000 | Old Republic Title Company |
Source: Public Records
Mortgage History
| Date | Status | Borrower | Loan Amount |
|---|---|---|---|
| Previous Owner | Kfouri Emile | $696,500 |
Source: Public Records
Tax History Compared to Growth
Tax History
| Year | Tax Paid | Tax Assessment Tax Assessment Total Assessment is a certain percentage of the fair market value that is determined by local assessors to be the total taxable value of land and additions on the property. | Land | Improvement |
|---|---|---|---|---|
| 2025 | $18,006 | $1,250,679 | $591,885 | $658,794 |
| 2024 | $18,006 | $1,226,157 | $580,280 | $645,877 |
| 2023 | $17,636 | $1,202,120 | $568,905 | $633,215 |
| 2022 | $16,429 | $1,154,922 | $557,750 | $597,172 |
| 2021 | $15,662 | $1,088,161 | $546,815 | $541,346 |
| 2020 | $15,526 | $1,077,007 | $541,210 | $535,797 |
| 2019 | $15,048 | $1,055,894 | $530,600 | $525,294 |
| 2018 | $14,912 | $1,035,198 | $520,200 | $514,998 |
| 2017 | $14,373 | $1,014,900 | $510,000 | $504,900 |
| 2016 | $11,519 | $786,818 | $472,091 | $314,727 |
| 2015 | $4,965 | $238,571 | $79,126 | $159,445 |
| 2014 | $4,708 | $233,899 | $77,576 | $156,323 |
Source: Public Records
Map
Nearby Homes