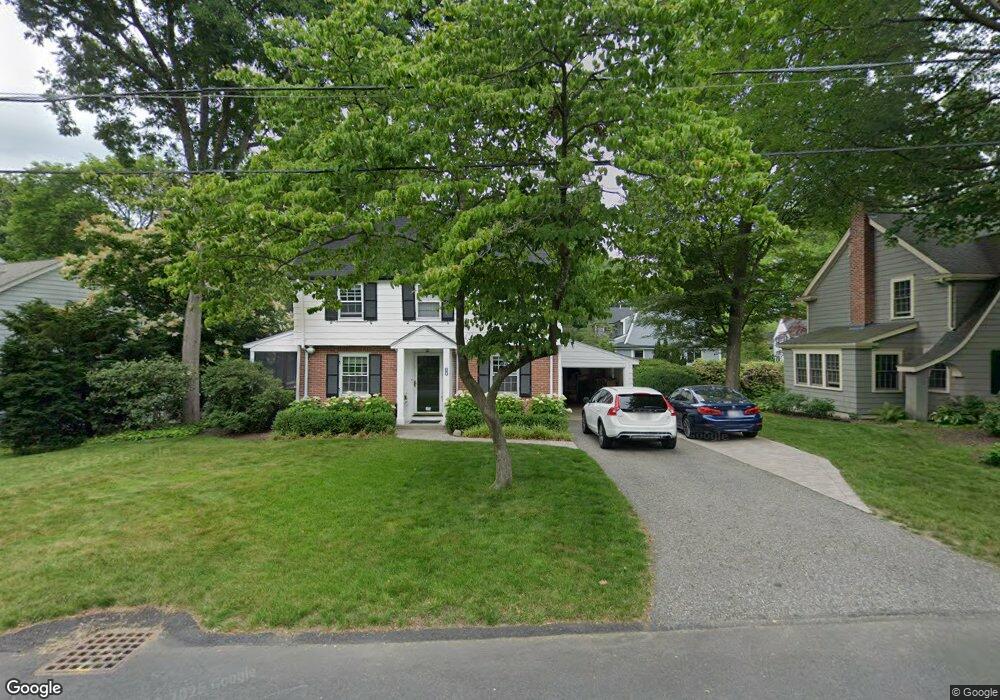
11 Martin Rd Wellesley Hills, MA 02481
Estimated Value: $1,354,000 - $1,428,000
3
Beds
3
Baths
2,379
Sq Ft
$588/Sq Ft
Est. Value
About This Home
This home is located at 11 Martin Rd, Wellesley Hills, MA 02481 and is currently estimated at $1,398,915, approximately $588 per square foot. 11 Martin Rd is a home located in Norfolk County with nearby schools including Katharine Lee Bates Elementary School, Wellesley Middle School, and Wellesley Sr High School.
Ownership History
Date
Name
Owned For
Owner Type
Purchase Details
Closed on
Nov 9, 2012
Sold by
Richard H Lansing Ft and Lansing Richard H
Bought by
Lansing 2012 Richard H and Lansing Richard H
Current Estimated Value
Purchase Details
Closed on
Jul 21, 2008
Sold by
Lansing Margot S and Lansing Richard H
Bought by
Margot S Lansing Ft and Lansing Margot S
Purchase Details
Closed on
Jul 16, 2008
Sold by
Lansing Margot S and Lansing Richard H
Bought by
Margot S Lansing Ft and Lansing Margot S
Purchase Details
Closed on
Apr 29, 2008
Sold by
Margot Slansing Ft
Bought by
Lansing Margot S and Lansing Richard H
Home Financials for this Owner
Home Financials are based on the most recent Mortgage that was taken out on this home.
Original Mortgage
$300,000
Interest Rate
6.22%
Mortgage Type
Purchase Money Mortgage
Create a Home Valuation Report for This Property
The Home Valuation Report is an in-depth analysis detailing your home's value as well as a comparison with similar homes in the area
Home Values in the Area
Average Home Value in this Area
Purchase History
| Date | Buyer | Sale Price | Title Company |
|---|---|---|---|
| Lansing 2012 Richard H | -- | -- | |
| Margot S Lansing Ft | -- | -- | |
| Margot S Lansing Ft | -- | -- | |
| Lansing Margot S | -- | -- |
Source: Public Records
Mortgage History
| Date | Status | Borrower | Loan Amount |
|---|---|---|---|
| Previous Owner | Lansing Margot S | $300,000 | |
| Previous Owner | Lansing Margot S | $100,000 |
Source: Public Records
Tax History Compared to Growth
Tax History
| Year | Tax Paid | Tax Assessment Tax Assessment Total Assessment is a certain percentage of the fair market value that is determined by local assessors to be the total taxable value of land and additions on the property. | Land | Improvement |
|---|---|---|---|---|
| 2025 | $11,771 | $1,145,000 | $945,000 | $200,000 |
| 2024 | $10,556 | $1,014,000 | $821,000 | $193,000 |
| 2023 | $10,305 | $900,000 | $698,000 | $202,000 |
| 2022 | $9,636 | $825,000 | $598,000 | $227,000 |
| 2021 | $9,694 | $825,000 | $598,000 | $227,000 |
| 2020 | $9,537 | $825,000 | $598,000 | $227,000 |
| 2019 | $9,545 | $825,000 | $598,000 | $227,000 |
| 2018 | $9,369 | $784,000 | $581,000 | $203,000 |
| 2017 | $9,243 | $784,000 | $581,000 | $203,000 |
| 2016 | $9,074 | $767,000 | $571,000 | $196,000 |
| 2015 | $8,751 | $757,000 | $560,000 | $197,000 |
Source: Public Records
Map
Nearby Homes
- 6 Wilde Rd
- 23 Pilgrim Rd
- 6 Norwich Rd
- 12 Russell Rd Unit 405
- 365 Weston Rd
- 13 Cavanaugh Rd
- 18 Patton Rd
- 209 Bristol Rd
- 36 Oakridge Rd
- 51 Boulder Brook Rd
- 428 Weston Rd
- 63 Oak St Unit B
- 16 Stearns Rd Unit 101
- 16 Stearns Rd Unit 302
- 16 Stearns Rd Unit 207
- 16 Stearns Rd Unit 301
- 16 Stearns Rd Unit 103
- 16 Stearns Rd Unit 202
- 16 Stearns Rd Unit 304
- 16 Stearns Rd Unit 104