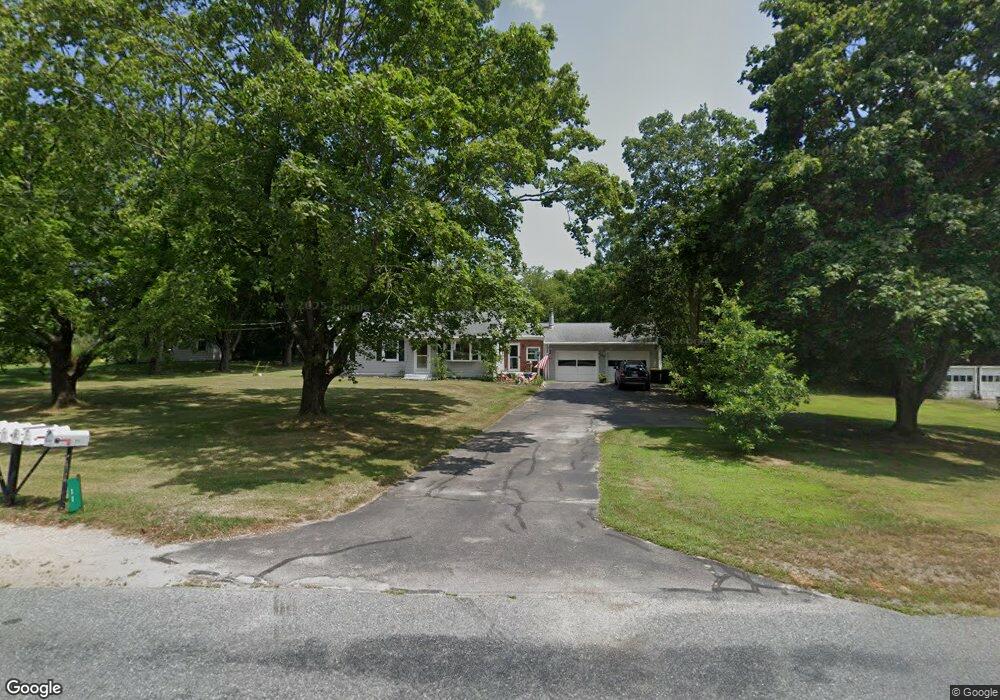
11 Mason St Rehoboth, MA 02769
Estimated Value: $452,290 - $625,000
3
Beds
1
Bath
1,222
Sq Ft
$420/Sq Ft
Est. Value
About This Home
This home is located at 11 Mason St, Rehoboth, MA 02769 and is currently estimated at $513,323, approximately $420 per square foot. 11 Mason St is a home located in Bristol County with nearby schools including Dighton-Rehoboth Regional High School, Highlander Charter Middle and High School, and East Bay Career Academy.
Ownership History
Date
Name
Owned For
Owner Type
Purchase Details
Closed on
Dec 19, 2017
Sold by
Edmund Silva Irt
Bought by
Grant Linda M and Grant Kenneth R
Current Estimated Value
Home Financials for this Owner
Home Financials are based on the most recent Mortgage that was taken out on this home.
Original Mortgage
$60,000
Outstanding Balance
$50,515
Interest Rate
3.94%
Mortgage Type
New Conventional
Estimated Equity
$462,808
Create a Home Valuation Report for This Property
The Home Valuation Report is an in-depth analysis detailing your home's value as well as a comparison with similar homes in the area
Home Values in the Area
Average Home Value in this Area
Purchase History
| Date | Buyer | Sale Price | Title Company |
|---|---|---|---|
| Grant Linda M | $240,000 | -- |
Source: Public Records
Mortgage History
| Date | Status | Borrower | Loan Amount |
|---|---|---|---|
| Open | Grant Linda M | $60,000 |
Source: Public Records
Tax History Compared to Growth
Tax History
| Year | Tax Paid | Tax Assessment Tax Assessment Total Assessment is a certain percentage of the fair market value that is determined by local assessors to be the total taxable value of land and additions on the property. | Land | Improvement |
|---|---|---|---|---|
| 2025 | $42 | $372,700 | $171,400 | $201,300 |
| 2024 | $4,142 | $364,600 | $171,400 | $193,200 |
| 2023 | $4,072 | $351,600 | $168,100 | $183,500 |
| 2022 | $3,992 | $315,100 | $160,500 | $154,600 |
| 2021 | $3,792 | $286,400 | $145,500 | $140,900 |
| 2020 | $3,672 | $279,900 | $145,500 | $134,400 |
| 2018 | $3,269 | $273,100 | $138,600 | $134,500 |
| 2017 | $3,066 | $244,100 | $138,600 | $105,500 |
| 2016 | $2,860 | $235,400 | $138,600 | $96,800 |
| 2015 | $2,668 | $216,700 | $132,000 | $84,700 |
| 2014 | $2,617 | $210,400 | $125,700 | $84,700 |
Source: Public Records
Map
Nearby Homes
- 32 Providence St
- 203 Providence St Bldr Lot 5
- 205 Providence St Bldr Lot 3
- 127 Mason St
- 198 Brook St
- 17 Sassafras Rd
- 267 Chestnut St
- 0 Winter St
- 36 Columbine Rd
- 1 Cedarbrook Unit A
- 10 Quaker Ln
- 67 Wheeler St
- 195 Barney Ave
- 92 Martin St
- 3a Johnnies Way
- 129 Cameron Way
- 3b Johnnies Way
- 42 Linden Ln
- 3 Johnnies Way
- 7 Johnnies Way
- 15 Mason St
- 3 Mason St
- 8 Mason St
- 17 Mason St
- 123 Providence St
- 135 Providence St
- 6 Mason St
- 12 Mason St
- 119 Providence St
- 25 Mason St
- 18 Mason St
- 141 Providence St
- 126 Providence St
- 115 Providence St
- 145 Providence St
- 10 Mason St Unit 14
- 111 Providence St
- 146 Providence St
- 114 Providence St
- 150 Providence St