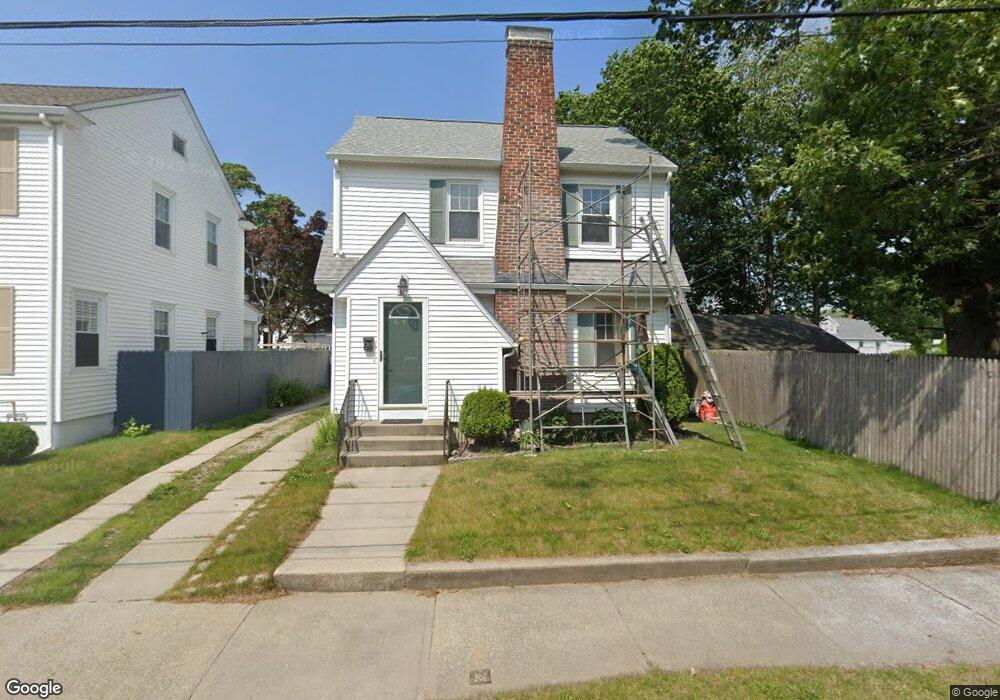
11 Melrose St Cranston, RI 02910
Auburn NeighborhoodEstimated Value: $355,000 - $459,000
2
Beds
2
Baths
1,452
Sq Ft
$269/Sq Ft
Est. Value
About This Home
This home is located at 11 Melrose St, Cranston, RI 02910 and is currently estimated at $390,934, approximately $269 per square foot. 11 Melrose St is a home located in Providence County with nearby schools including Eden Park Elementary School, Park View Middle School, and Cranston High School East.
Ownership History
Date
Name
Owned For
Owner Type
Purchase Details
Closed on
May 27, 2010
Sold by
Mulligan James and Mulligan Brandi
Bought by
Findlay Laura A
Current Estimated Value
Home Financials for this Owner
Home Financials are based on the most recent Mortgage that was taken out on this home.
Original Mortgage
$144,000
Outstanding Balance
$96,895
Interest Rate
5.13%
Mortgage Type
Purchase Money Mortgage
Estimated Equity
$294,039
Purchase Details
Closed on
Aug 12, 2003
Sold by
Buonfiglio Stephanie
Bought by
Mulligan James and Mulligan Brandi
Home Financials for this Owner
Home Financials are based on the most recent Mortgage that was taken out on this home.
Original Mortgage
$126,750
Interest Rate
5.28%
Purchase Details
Closed on
Sep 21, 1998
Sold by
Politelli Martin J and Politelli Christine
Bought by
Buonfiglio Stephanie A
Create a Home Valuation Report for This Property
The Home Valuation Report is an in-depth analysis detailing your home's value as well as a comparison with similar homes in the area
Home Values in the Area
Average Home Value in this Area
Purchase History
| Date | Buyer | Sale Price | Title Company |
|---|---|---|---|
| Findlay Laura A | $180,000 | -- | |
| Mulligan James | $169,000 | -- | |
| Buonfiglio Stephanie A | $81,000 | -- |
Source: Public Records
Mortgage History
| Date | Status | Borrower | Loan Amount |
|---|---|---|---|
| Open | Buonfiglio Stephanie A | $144,000 | |
| Previous Owner | Buonfiglio Stephanie A | $175,000 | |
| Previous Owner | Buonfiglio Stephanie A | $126,750 | |
| Previous Owner | Buonfiglio Stephanie A | $33,800 |
Source: Public Records
Tax History Compared to Growth
Tax History
| Year | Tax Paid | Tax Assessment Tax Assessment Total Assessment is a certain percentage of the fair market value that is determined by local assessors to be the total taxable value of land and additions on the property. | Land | Improvement |
|---|---|---|---|---|
| 2025 | $3,900 | $281,000 | $92,100 | $188,900 |
| 2024 | $3,824 | $281,000 | $92,100 | $188,900 |
| 2023 | $3,648 | $193,000 | $63,500 | $129,500 |
| 2022 | $3,572 | $193,000 | $63,500 | $129,500 |
| 2021 | $3,474 | $193,000 | $63,500 | $129,500 |
| 2020 | $3,570 | $171,900 | $60,300 | $111,600 |
| 2019 | $3,570 | $171,900 | $60,300 | $111,600 |
| 2018 | $3,488 | $171,900 | $60,300 | $111,600 |
| 2017 | $3,386 | $147,600 | $44,500 | $103,100 |
| 2016 | $3,314 | $147,600 | $44,500 | $103,100 |
| 2015 | $3,314 | $147,600 | $44,500 | $103,100 |
| 2014 | $3,161 | $138,400 | $44,500 | $93,900 |
Source: Public Records
Map
Nearby Homes
- 130 Wollaston St
- 140 Concord Ave
- 129 Wollaston St
- 51 Norfolk St
- 115 Norfolk St
- 12 Stevens Rd
- 36 Blackamore Ave
- 1 Rolfe Square
- 75 High School Ave
- 483 Pontiac Ave
- 140 Eldridge St
- 74 Leslie St
- 128 Elsie St
- 18 Glenwood Ave
- 136 Frankfort St
- 55 Columbus Blvd
- 124 Clarence St
- 46 Roslyn Ave
- 210 Crescent Ave
- 638 Pontiac Ave